Fox River Grove: Fire Incidents, Illinois (IL)
Where are fire incidents reported in Fox River Grove, IL
Something went wrong! Please refresh the page.
|
| |||||||||||||||||||||||||||||||||||||||||||||||||||||||||||||||||||||||||||||||||||||||||||||||||||||||||||||
2002 - 2018 National Fire Incident Reporting System (NFIRS) incidents
- Incident types reported to NFIRS in Fox River Grove, IL
- 2,01560.1%Rescue & EMS
- 43112.9%Hazardous Condition
- 3319.9%Fire
- 2337.0%Service Call
- 1755.2%False Alarm
- 1624.8%Good Intent Call
- Fire incident types reported to NFIRS in Fox River Grove, IL
- 16850.8%Structure Fires
- 12337.2%Outside Fires
- 267.9%Mobile Property/Vehicle Fires
- 144.2%Other
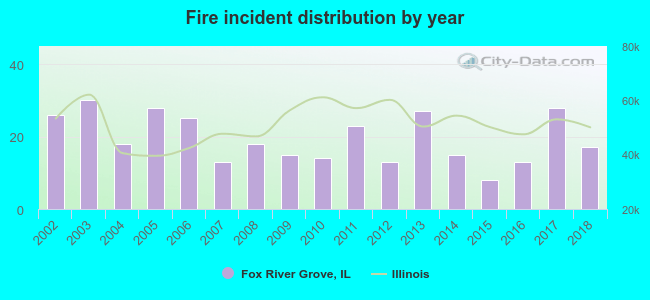 Based on the data from the years 2002 - 2018 the average number of fires per year is 19. The highest number of fire incidents - 30 took place in 2003, and the least - 8 in 2015. The data has a declining trend.
 Based on the data from the years 2002 - 2018 the average number of fire-related yearly casualties is 1. The highest number of reported casualties - 2 took place in 2005, and the lowest - 0 in 2003. The data has a constant trend.
 28.4% incidents where reported in the morning and 71.6% in the evening. The most fires (22.4%) took place on Sunday, and the least (8.5%) on Friday.
 According to the 331 fires from years 2002 - 2018 most fires (12.1%) took place during January, and the least (3.6%) in February.
 Out of all 3,352 cases reported during the years 2002 - 2018, the most belonged to the categories: Rescue & EMS (60.1%), Hazardous Condition (12.9%), and Fire (9.9%).
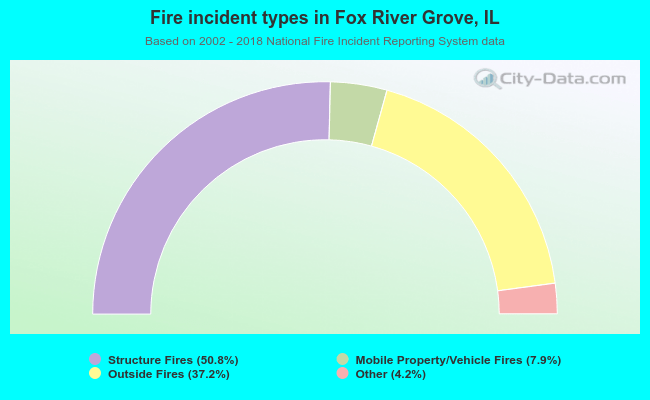 When looking into fire subcategories, the most incidents belonged to: Structure Fires (50.8%), and Outside Fires (37.2%).