Fort Sumner: Fire Incidents, New Mexico (NM)
Where are fire incidents reported in Fort Sumner, NM
Something went wrong! Please refresh the page.
|
| |||||||||||||||||||||||||||||||||||||||||||||||||||||||||||||||||||||||||||||||||||||||||||||||||||||||||||||
| Other | 17 | |||||||||||||||||||||||||||||||||||||||||||||||||||||||||||||||||||||||||||||||||||||||||||||||||||||||||||||
2006 - 2018 National Fire Incident Reporting System (NFIRS) incidents
- Incident types reported to NFIRS in Fort Sumner, NM
- 32963.1%Fire
- 10720.5%Rescue & EMS
- 479.0%Good Intent Call
- 183.5%Hazardous Condition
- 101.9%False Alarm
- 81.5%Service Call
- 10.2%Severe Weather
- 10.2%Special Incident
- Fire incident types reported to NFIRS in Fort Sumner, NM
- 22969.6%Outside Fires
- 5516.7%Structure Fires
- 3711.2%Mobile Property/Vehicle Fires
- 82.4%Other
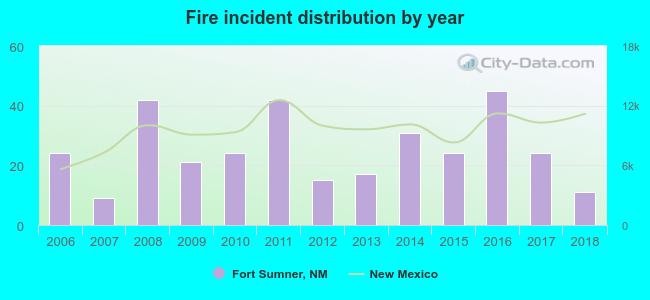 According to the data from the years 2006 - 2018 the average number of fires per year is 25. The highest number of fire incidents - 45 took place in 2016, and the least - 9 in 2007. The data has a dropping trend.
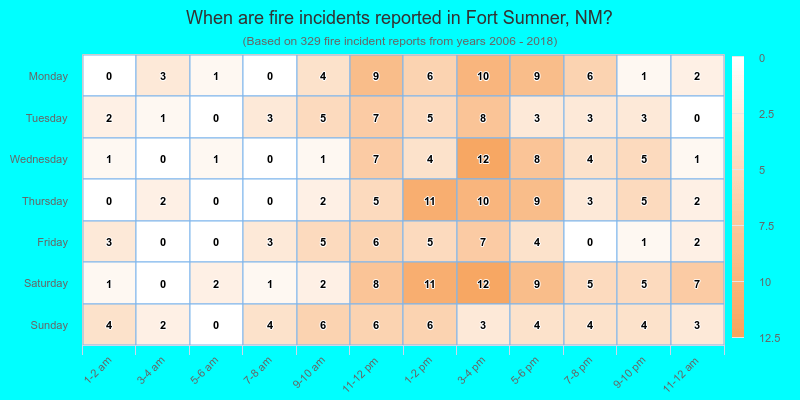
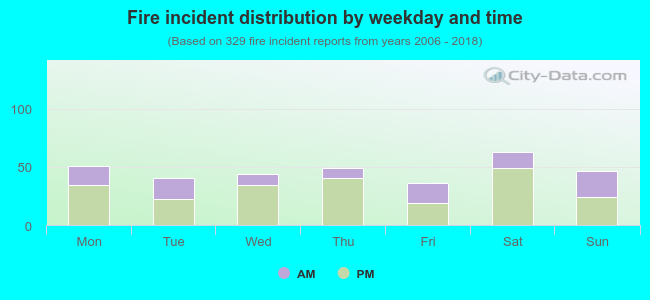 32.5% incidents where reported in the morning and 67.5% in the evening. The most fires (19.1%) took place on Saturday, and the least (10.9%) on Friday.
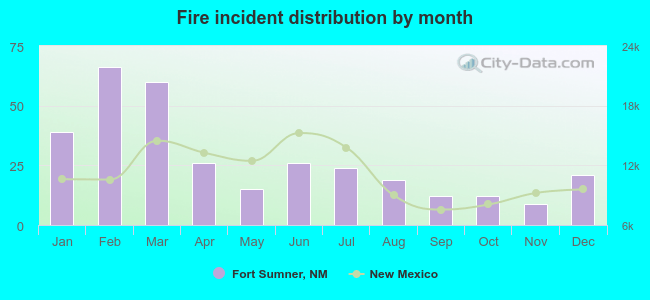 Based on the 329 reports from years 2006 - 2018 most fires (20.1%) took place during February, and the least (2.7%) in November.
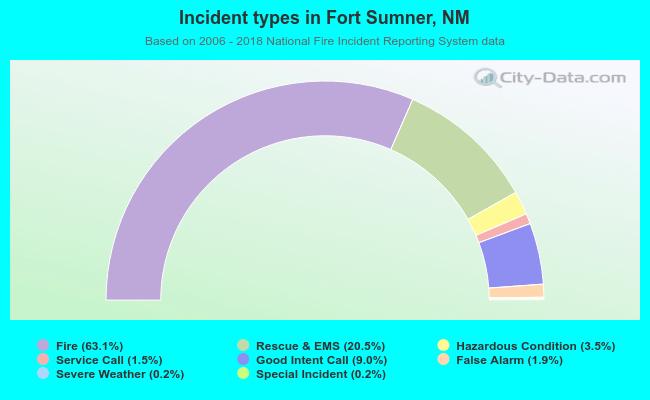 Out of all 521 cases reported during the years 2006 - 2018, the most belonged to the categories: Fire (63.1%), Overpressure Rupture (20.5%), and Service Call (9.0%).
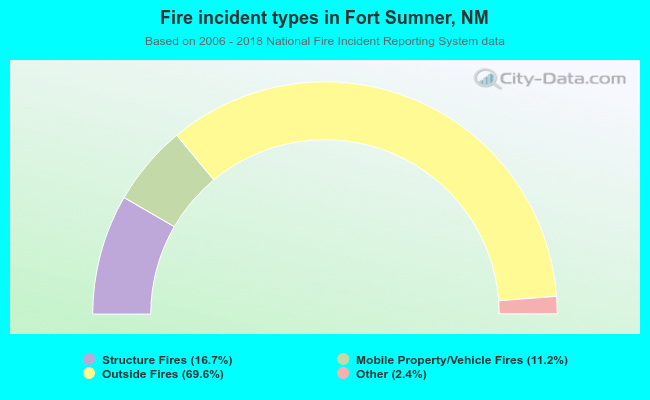 When looking into fire subcategories, the most incidents belonged to: Outside Fires (69.6%), and Structure Fires (16.7%).