Fort Bridger: Fire Incidents, Wyoming (WY)
Where are fire incidents reported in Fort Bridger, WY
Something went wrong! Please refresh the page.
|
| |||||||||||||||||||||||||||||||||||||||||||||||||||||||||||||||||||||||||||||||||||||||||||||
2002 - 2018 National Fire Incident Reporting System (NFIRS) incidents
- Incident types reported to NFIRS in Fort Bridger, WY
- 11157.8%Fire
- 2714.1%Rescue & EMS
- 2613.5%Hazardous Condition
- 2312.0%Good Intent Call
- 31.6%Service Call
- 10.5%False Alarm
- 10.5%Special Incident
- Fire incident types reported to NFIRS in Fort Bridger, WY
- 5751.4%Outside Fires
- 2522.5%Mobile Property/Vehicle Fires
- 2018.0%Structure Fires
- 98.1%Other
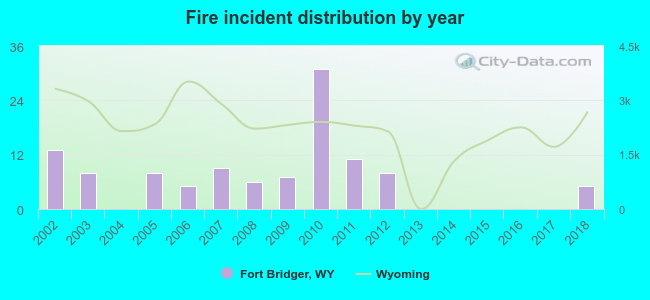 Based on the data from the years 2002 - 2018 the average number of fires per year is 7. The highest number of fire incidents - 31 took place in 2010, and the least - 0 in 2004. The data has a decreasing trend.
 29.7% incidents where reported in the morning and 70.3% in the evening. The most fires (20.7%) took place on Saturday, and the least (6.3%) on Friday.
 Based on the 111 fires from years 2002 - 2018 most fires (18.0%) took place during August, and the least (4.5%) in November.
 Out of all 192 cases reported during the years 2002 - 2018, the most belonged to the categories: Fire (57.8%), Overpressure Rupture (14.1%), and Rescue & EMS (13.5%).
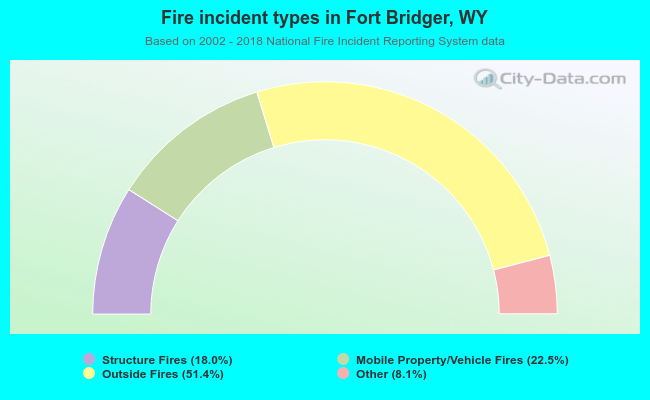 When looking into fire subcategories, the most incidents belonged to: Outside Fires (51.4%), and Mobile Property/Vehicle Fires (22.5%).