Forrest: Fire Incidents, Illinois (IL)
Where are fire incidents reported in Forrest, IL
Something went wrong! Please refresh the page.
|
| |||||||||||||||||||||||||||||||||||||||||||||||||||||||||||||||||||||||||||||||||||||||||||||||||||||||||||||
2002 - 2018 National Fire Incident Reporting System (NFIRS) incidents
- Incident types reported to NFIRS in Forrest, IL
- 38842.5%Rescue & EMS
- 28431.1%Fire
- 15817.3%Good Intent Call
- 535.8%Hazardous Condition
- 141.5%Service Call
- 121.3%False Alarm
- 30.3%Severe Weather
- 10.1%Overpressure Rupture
- Fire incident types reported to NFIRS in Forrest, IL
- 15153.2%Structure Fires
- 10737.7%Outside Fires
- 196.7%Mobile Property/Vehicle Fires
- 72.5%Other
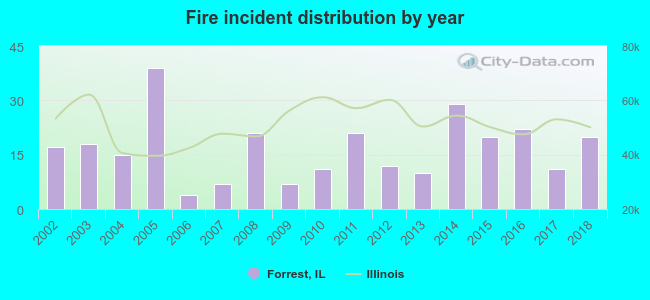 Based on the data from the years 2002 - 2018 the average number of fires per year is 17. The highest number of fire incidents - 39 took place in 2005, and the least - 4 in 2006. The data has a rising trend.
 34.2% incidents where reported in the morning and 65.8% in the evening. The most fires (19.0%) took place on Thursday, and the least (12.3%) on Monday.
 Based on the 284 fires from years 2002 - 2018 most fires (13.0%) took place during March, and the least (4.9%) in June.
 Out of all 913 cases reported during the years 2002 - 2018, the most belonged to the categories: Rescue & EMS (42.5%), Fire (31.1%), and Good Intent Call (17.3%).
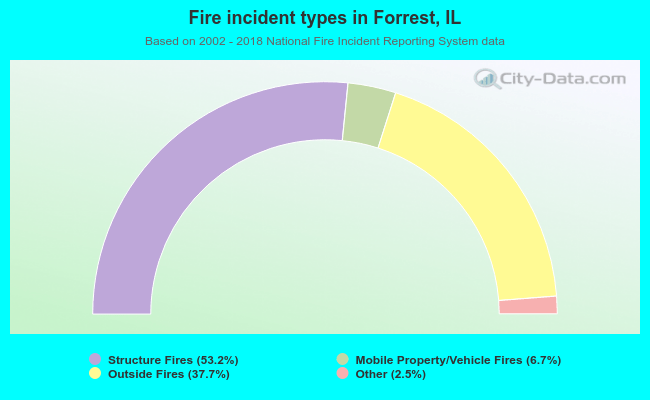 When looking into fire subcategories, the most reports belonged to: Structure Fires (53.2%), and Outside Fires (37.7%).