Flowood: Fire Incidents, Mississippi (MS)
Where are fire incidents reported in Flowood, MS
Something went wrong! Please refresh the page.
| Fire incidents reported | |
|---|---|
| Sreet name | Count |
| LAKELAND DR | 364 |
| FLOWOOD DR | 188 |
| OLD FANNIN RD | 86 |
| LUCKNEY RD | 50 |
| OLD BRANDON RD | 50 |
| DOGWOOD BLVD | 38 |
| FANNIN RD | 38 |
| LAYFAIR DR | 38 |
| MANGUM DR | 38 |
| AIRPORT RD | 34 |
| GRANTS FERRY RD | 34 |
| VINE DR | 30 |
| RIDGE WAY | 24 |
| LIBERTY RD | 22 |
| FLYNT DR | 20 |
| HWY 80 | 18 |
| PROMENADE BLVD | 18 |
| RIVER OAKS DR | 18 |
| WIRTZ RD | 18 |
| CASEY LN | 16 |
| UNDERWOOD DR | 16 |
| COOPER RD | 14 |
| MANSHIP RD | 14 |
| PAYNE DR | 14 |
| PLAZA DR | 14 |
| DEXTER DR | 12 |
| FOURTH ST | 12 |
| CASEY'S LN | 10 |
| TOP ST | 10 |
| WINNER CIR | 10 |
2003 - 2018 National Fire Incident Reporting System (NFIRS) incidents
- Incident types reported to NFIRS in Flowood, MS
- 6,54166.1%Rescue & EMS
- 9629.7%False Alarm
- 9459.6%Fire
- 6326.4%Hazardous Condition
- 5455.5%Good Intent Call
- 2402.4%Service Call
- 110.1%Overpressure Rupture
- 110.1%Severe Weather
- Fire incident types reported to NFIRS in Flowood, MS
- 45147.7%Outside Fires
- 26027.5%Mobile Property/Vehicle Fires
- 22223.5%Structure Fires
- 121.3%Other
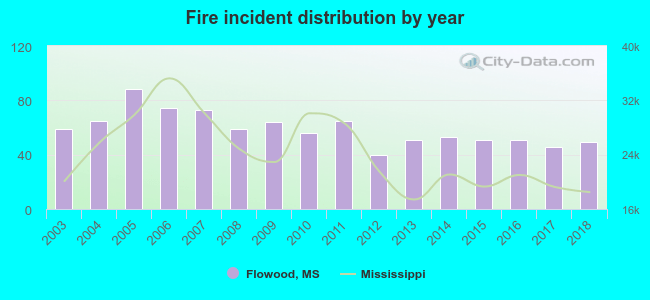 According to the data from the years 2003 - 2018 the average number of fire incidents per year is 59. The highest number of fires - 88 took place in 2005, and the least - 40 in 2012. The data has a dropping trend.
The average number of yearly fire incidents per 10k residents in Flowood, MS compared to nearest cities:
(Note: Based on data for the last 3 years, including only cities with population 5,000 and above)
| Flowood: | 56.9 |
| Pearl: | 32.7 |
| Jackson: | 25.9 |
| Richland: | 54.7 |
| Ridgeland: | 34.4 |
| Brandon: | 99.6 |
| Madison: | 40.1 |
| Clinton: | 27.8 |
| Byram: | 51.3 |
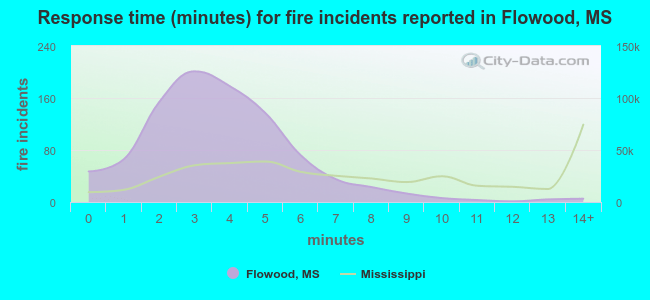 The median response time based on all reported fire incidents is 4 minutes. This is lower compared to the state median value.
The median response time in Flowood, MS compared to nearest cities:
(Note: Based on data for all years, including only cities with at least 500 fire incidents)
| Flowood: | 4 minutes |
| Pearl: | 4 minutes |
| Jackson: | 5 minutes |
| Richland: | 3 minutes |
| Ridgeland: | 4 minutes |
| Brandon: | 7 minutes |
| Madison: | 5 minutes |
| Florence: | 9 minutes |
| Clinton: | 5 minutes |
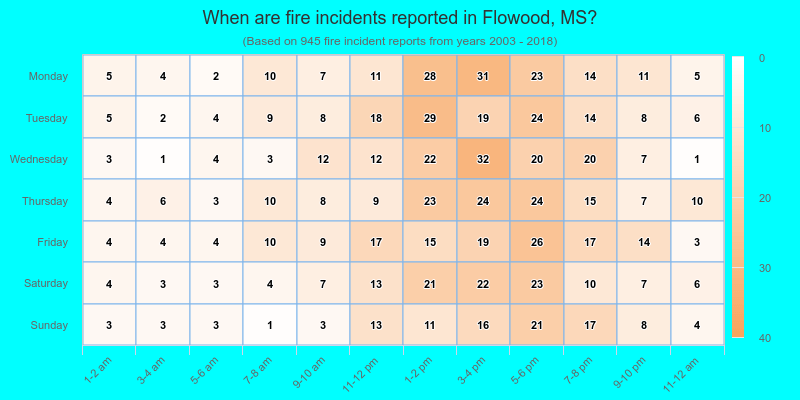
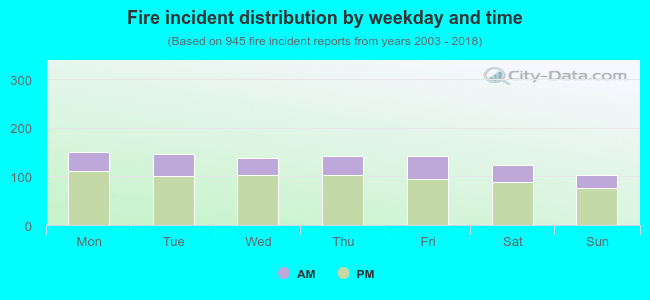 28.4% incidents where reported in the morning and 71.6% in the evening. The most fires (16.0%) took place on Monday, and the least (10.9%) on Sunday.
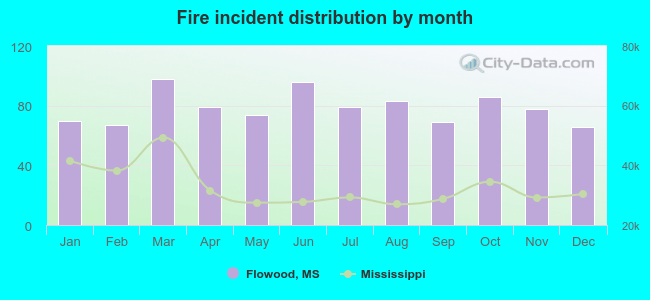 Based on the 945 fire incident reports from years 2003 - 2018 most fires (10.4%) took place during March, and the least (7.0%) in December.
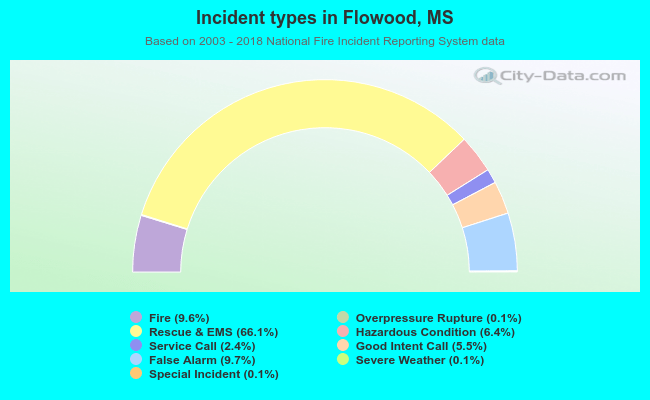 Out of all 9,893 cases reported during the years 2003 - 2018, the most belonged to the categories: Rescue & EMS (66.1%), False Alarm (9.7%), and Fire (9.6%).
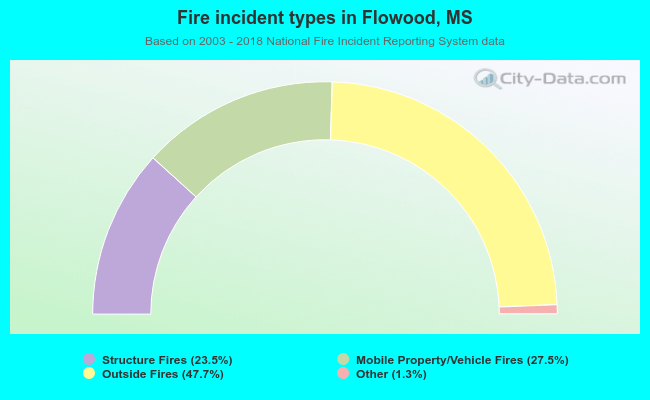 When looking into fire subcategories, the most incidents belonged to: Outside Fires (47.7%), and Mobile Property/Vehicle Fires (27.5%).