Flower Hill: Fire Incidents, New York (NY)
Where are fire incidents reported in Flower Hill, NY
Something went wrong! Please refresh the page.
|
| |||||||||||||||||||||||||||||||||||||||||||||||||||||||||||||||||||||||||||||||||||||||||||||
2003 - 2018 National Fire Incident Reporting System (NFIRS) incidents
- Incident types reported to NFIRS in Flower Hill, NY
- 35432.8%False Alarm
- 29727.5%Hazardous Condition
- 18216.9%Rescue & EMS
- 1019.4%Fire
- 696.4%Service Call
- 696.4%Good Intent Call
- 40.4%Special Incident
- 20.2%Overpressure Rupture
- Fire incident types reported to NFIRS in Flower Hill, NY
- 7978.2%Structure Fires
- 1211.9%Outside Fires
- 65.9%Mobile Property/Vehicle Fires
- 44.0%Other
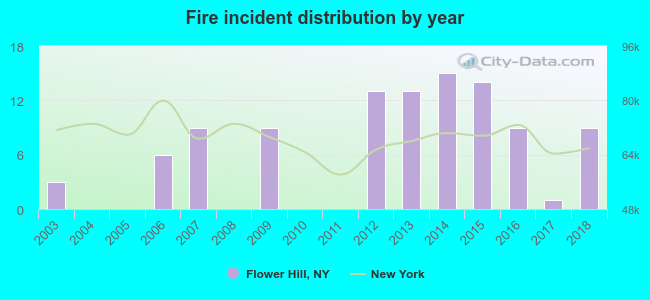 According to the data from the years 2003 - 2018 the average number of fire incidents per year is 6. The highest number of fires - 15 took place in 2014, and the least - 0 in 2004. The data has a rising trend.
 28.7% incidents where reported in the morning and 71.3% in the evening. The most fires (17.8%) took place on Wednesday, and the least (8.9%) on Thursday.
 Based on the 101 fire incident reports from years 2003 - 2018 most fires (11.9%) took place during November, and the least (5.0%) in June.
 Out of all 1,079 cases reported during the years 2003 - 2018, the most belonged to the categories: False Alarm (32.8%), Hazardous Condition (27.5%), and Rescue & EMS (16.9%).
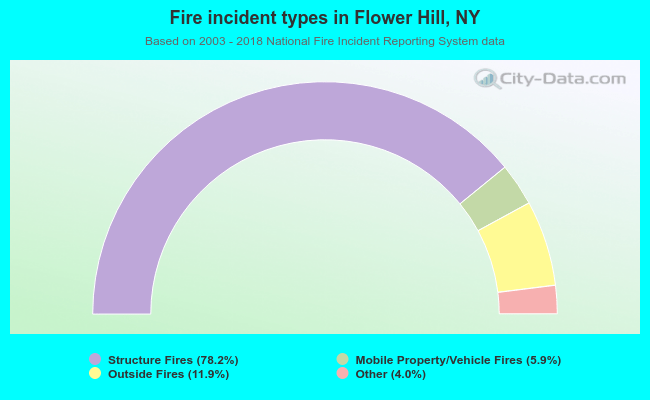 When looking into fire subcategories, the most incidents belonged to: Structure Fires (78.2%), and Outside Fires (11.9%).