| Fire incidents reported |
|---|
| Sreet name | Count |
|---|
| US HWY 2 | 12 | | US HWY 2 HWY | 12 | | US HWY. 2 HWY | 10 | | HARDING RD | 8 | | LAKE ELWOOD RD | 8 | | 2ND CROSSING RD | 4 | | BLOME HELGREN RD | 4 | | CNTY HWY N HWY | 4 | | COUNTY HWY N | 4 | | CROSSCUT ROAD RD | 4 | | CTH N HWY | 4 | | HWY 70 | 4 | | MILLER RD | 4 | | MONTGOMERY LAKE RD | 4 | | OLIVE AVE | 4 | | 1 ST CROSSING RD | 2 | | 100 TOWER DR | 2 | | 1641 CNTY HWY U | 2 | | 1998 MAIN RD | 2 | | 1ST CROSSING RD | 2 | | 1ST CROSSING ROAD RD | 2 | | 2212 CNTY HWY N | 2 | | 2249 TOBY RD | 2 | | 2706 MILLER RD. | 2 | | 4314 SOUTH SHORE DRIVE | 2 |
| | | Fire incidents reported |
|---|
| Sreet name | Count |
|---|
| 4314 SOUTH SHORE RD. | 2 | | 4475 BLOME HELGREN RD | 2 | | 5012 ARTHUR DR | 2 | | 5156 CNTY C | 2 | | 656 RICE RD | 2 | | ANDERSON RD | 2 | | ARDENS ROAD | 2 | | B & B RIVER LANE LN | 2 | | BEDNARSKI LANE LN | 2 | | BESSIE BABBET RD | 2 | | BILL ANDERSON DR | 2 | | BLOME HELGREN RD | 2 | | BLOOME HELGRENE RD | 2 | | BONNIE VIEW RD | 2 | | BRULE DAM RD | 2 | | BRULE LANDING RD | 2 | | BUCHANAN LN | 2 | | BUSH LN | 2 | | CALS LANE | 2 | | CALS LN | 2 | | CENTRAL AV | 2 | | CENTRAL AVE. AVE | 2 | | CHAPIN ST | 2 | | CIRCLE DRIVE DR | 2 | | CLIFFS RD | 2 |
|
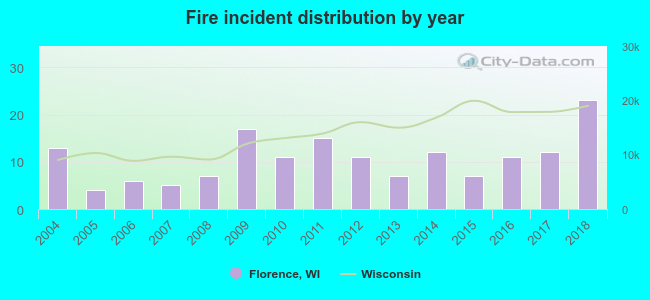 Based on the data from the years 2004 - 2018 the average number of fire incidents per year is 11. The highest number of reported fires - 23 took place in 2018, and the least - 4 in 2005. The data has a rising trend.
 29.2% incidents where reported in the morning and 70.8% in the evening. The most fires (21.7%) took place on Thursday, and the least (9.9%) on Tuesday.
 Based on the 161 fires from years 2004 - 2018 most fires (20.5%) took place during May, and the least (3.7%) in January.
 Out of all 253 cases reported during the years 2004 - 2018, the most belonged to the categories: Fire (63.6%), Rescue & EMS (17.4%), and Overpressure Rupture (16.2%).
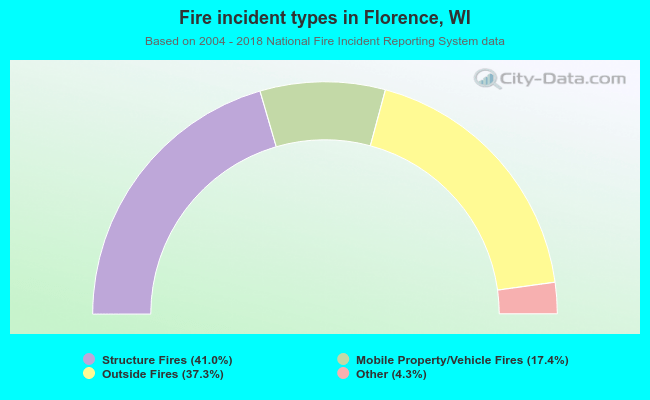 When looking into fire subcategories, the most incidents belonged to: Structure Fires (41.0%), and Outside Fires (37.3%).