Florence: Fire Incidents, Alabama (AL)
Where are fire incidents reported in Florence, AL
Something went wrong! Please refresh the page.
| Fire incidents reported | |
|---|---|
| Sreet name | Count |
| FLORENCE BLVD | 607 |
| COX CREEK | 369 |
| HELTON DR | 351 |
| HWY 17 | 331 |
| CHISHOLM RD | 305 |
| PINE ST | 258 |
| HERMITAGE DR | 245 |
| CHERRY HILL HOMES | 232 |
| HUNTSVILLE RD | 231 |
| MOBILE ST | 205 |
| HWY 157 | 188 |
| CEDAR ST | 160 |
| COURT ST | 160 |
| HOUGH RD | 160 |
| COUNTY RD 24 | 154 |
| MARS HILL RD | 151 |
| COUNTY RD 7 | 150 |
| CLOVERDALE RD | 149 |
| CARVER HOMES | 147 |
| PATTON ST | 141 |
| COUNTY RD 8 | 139 |
| VETERANS DR | 136 |
| ROYAL | 113 |
| DARBY DR | 107 |
| COUNTY RD 61 | 103 |
| WOOD | 97 |
| SWEETWATER | 96 |
| TENNESSEE ST | 92 |
| ECLIPSE ST | 89 |
| TRADE ST | 88 |
2002 - 2018 National Fire Incident Reporting System (NFIRS) incidents
- Incident types reported to NFIRS in Florence, AL
- 18,45565.0%Rescue & EMS
- 4,07514.3%Fire
- 2,85010.0%False Alarm
- 1,3854.9%Hazardous Condition
- 7212.5%Good Intent Call
- 6922.4%Service Call
- 1390.5%Overpressure Rupture
- 640.2%Special Incident
- Fire incident types reported to NFIRS in Florence, AL
- 1,83545.0%Structure Fires
- 1,35833.3%Outside Fires
- 60214.8%Mobile Property/Vehicle Fires
- 2806.9%Other
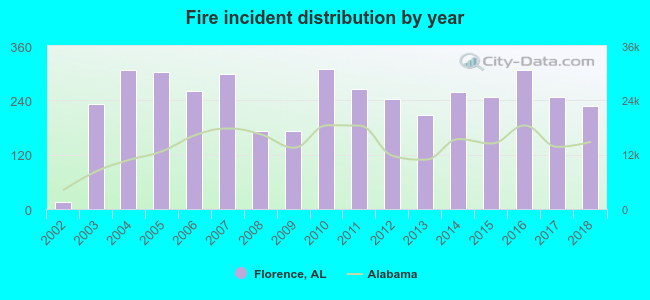 Based on the data from the years 2002 - 2018 the average number of fire incidents per year is 240. The highest number of reported fires - 310 took place in 2010, and the least - 15 in 2002. The data has a growing trend.
The average number of yearly fire incidents per 10k residents in Florence, AL compared to nearest cities:
(Note: Based on data for the last 3 years, including only cities with population 5,000 and above)
| Florence: | 64.9 |
| Muscle Shoals: | 21.1 |
| Tuscumbia: | 49.2 |
| Cloverdale: | 1.6 |
| Russellville: | 71.0 |
| Athens: | 38.1 |
| Decatur: | 46.8 |
| Danville: | 1.6 |
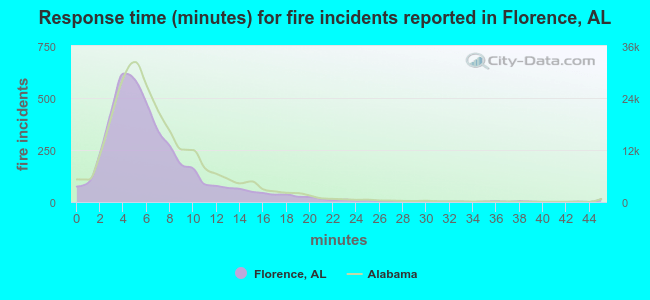 The median response time based on all reported fire incidents is 5 minutes. This is lower compared to the Alabama median value.
The median response time in Florence, AL compared to nearest cities:
(Note: Based on data for all years, including only cities with at least 500 fire incidents)
| Florence: | 5 minutes |
| Muscle Shoals: | 4 minutes |
| Russellville: | 5 minutes |
| Moulton: | 9 minutes |
| Athens: | 4 minutes |
| Haleyville: | 6 minutes |
| Decatur: | 5 minutes |
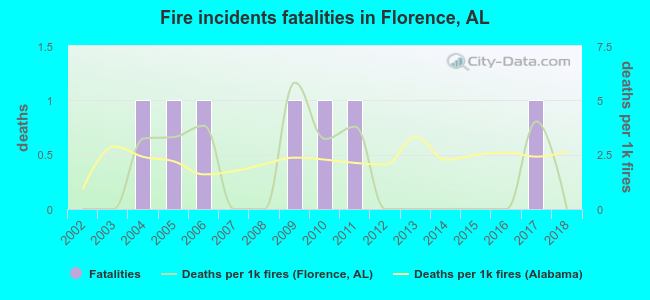 Based on the reports from the years 2002 - 2018 the average number of fire-related fatalities per year is 0. The highest number of deaths - 1 took place in 2004, and the lowest - 0 in 2002. The data has a constant trend.
The average number of fatalities per 1,000 fires is 2. This indicator was the highest - 6 in 2009, and the lowest 0 in 2002. The trend for deaths per 1,000 fire incidents is constant. Compared to the Alabama value the number of fatalities per 1,000 incidents is lower.
Based on the reports from the years 2002 - 2018 the average number of fire-related fatalities per year is 0. The highest number of deaths - 1 took place in 2004, and the lowest - 0 in 2002. The data has a constant trend.
The average number of fatalities per 1,000 fires is 2. This indicator was the highest - 6 in 2009, and the lowest 0 in 2002. The trend for deaths per 1,000 fire incidents is constant. Compared to the Alabama value the number of fatalities per 1,000 incidents is lower.Deaths per 1,000 incidents in Florence, AL compared to nearest cities:
(Note: Based on data for all years, including only cities with at least 2,500 fire incidents)
| Florence: | 1.7 |
| Decatur: | 1.1 |
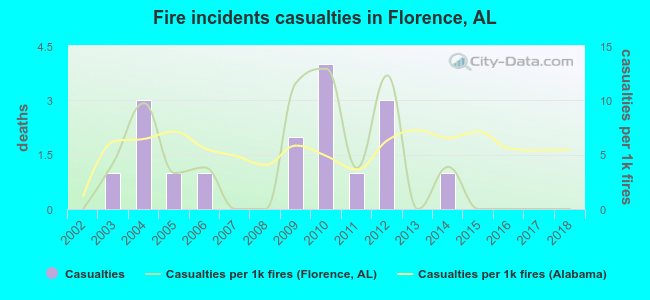 According to the reports from the years 2002 - 2018 the average number of fire-related yearly casualties is 1. The highest number of reported injuries - 4 took place in 2010, and the lowest - 0 in 2002. The data has a constant trend.
The average number of injuries per 1,000 fire incidents is 4. This indicator was the highest - 13 in 2010, and the lowest 0 in 2002. The trend for casualties per 1,000 fires is constant. Compared to the state value the number of casualties per 1,000 fire incidents is lower.
According to the reports from the years 2002 - 2018 the average number of fire-related yearly casualties is 1. The highest number of reported injuries - 4 took place in 2010, and the lowest - 0 in 2002. The data has a constant trend.
The average number of injuries per 1,000 fire incidents is 4. This indicator was the highest - 13 in 2010, and the lowest 0 in 2002. The trend for casualties per 1,000 fires is constant. Compared to the state value the number of casualties per 1,000 fire incidents is lower.Casualties per 1,000 incidents in Florence, AL compared to nearest cities:
(Note: Based on data for all years, including only cities with at least 500 fire incidents)
| Florence: | 4.2 |
| Muscle Shoals: | 0.9 |
| Russellville: | 3.4 |
| Moulton: | 2.7 |
| Athens: | 6.9 |
| Haleyville: | 2.8 |
| Decatur: | 2.7 |
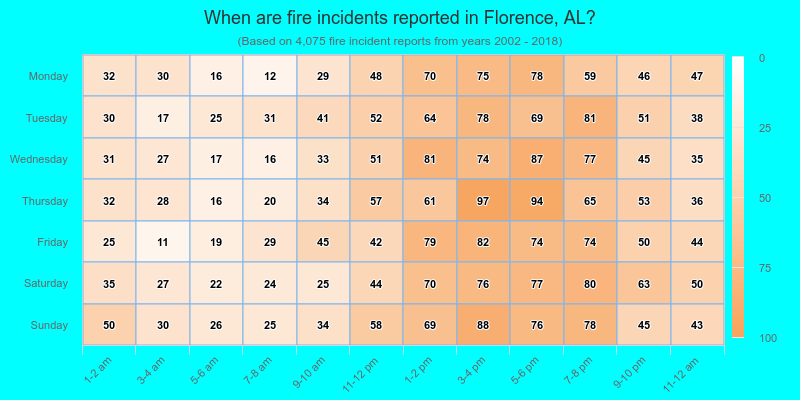
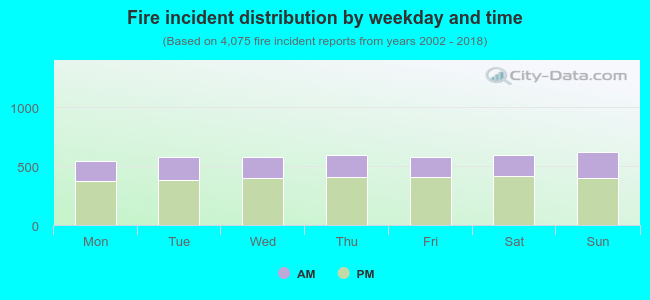 31.8% incidents where reported in the morning and 68.2% in the evening. The most fires (15.3%) took place on Sunday, and the least (13.3%) on Monday.
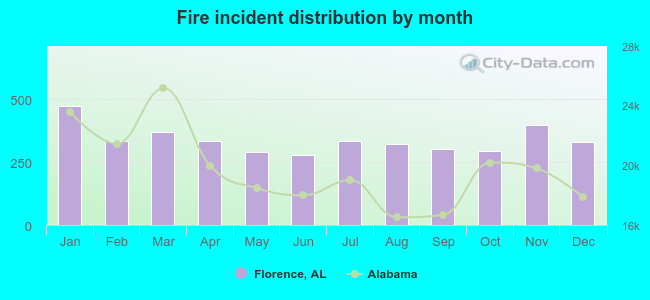 According to the 4,075 incident reports from years 2002 - 2018 most fires (11.7%) took place during January, and the least (6.8%) in June.
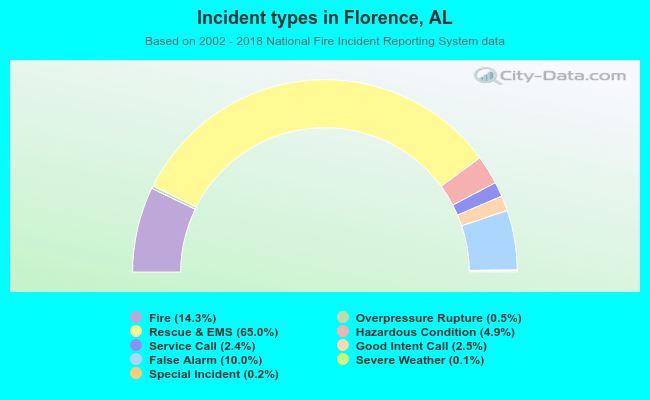 Out of all 28,409 cases reported during the years 2002 - 2018, the most belonged to the categories: Rescue & EMS (65.0%), Fire (14.3%), and False Alarm (10.0%).
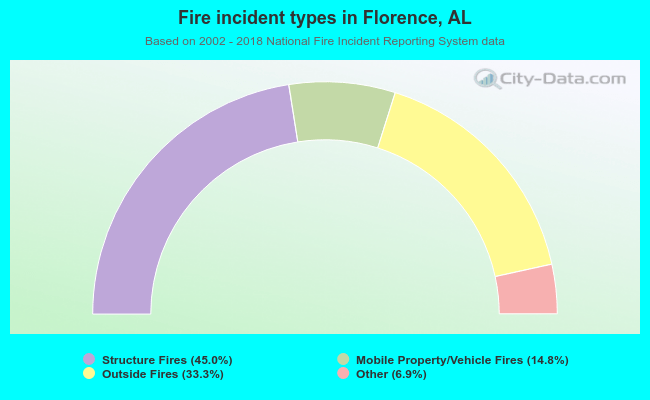 When looking into fire subcategories, the most incidents belonged to: Structure Fires (45.0%), and Outside Fires (33.3%).