Fleetwood: Fire Incidents, Pennsylvania (PA)
Where are fire incidents reported in Fleetwood, PA
Something went wrong! Please refresh the page.
|
| |||||||||||||||||||||||||||||||||||||||||||||||||||||||||||||||||||||||||||||||||||||||||||||||||||||||||||||
| Other | 142 | |||||||||||||||||||||||||||||||||||||||||||||||||||||||||||||||||||||||||||||||||||||||||||||||||||||||||||||
2003 - 2018 National Fire Incident Reporting System (NFIRS) incidents
- Incident types reported to NFIRS in Fleetwood, PA
- 96236.6%Fire
- 52419.9%Rescue & EMS
- 41715.9%Hazardous Condition
- 26910.2%Service Call
- 2118.0%Good Intent Call
- 1977.5%False Alarm
- 421.6%Special Incident
- 50.2%Severe Weather
- Fire incident types reported to NFIRS in Fleetwood, PA
- 51954.0%Structure Fires
- 27428.5%Outside Fires
- 10410.8%Mobile Property/Vehicle Fires
- 656.8%Other
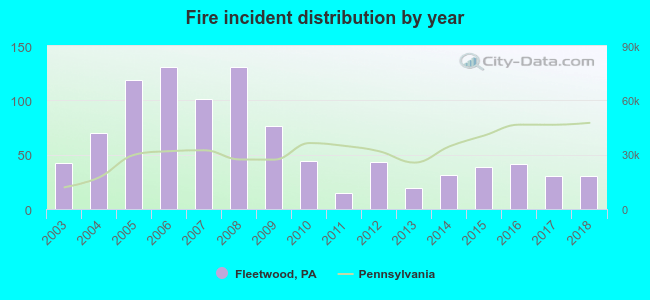 Based on the data from the years 2003 - 2018 the average number of fire incidents per year is 60. The highest number of reported fire incidents - 131 took place in 2006, and the least - 15 in 2011. The data has a declining trend.
 The median response time based on all reported fire incidents is 8 minutes. This is higher compared to the Pennsylvania median value.
The median response time in Fleetwood, PA compared to nearest cities:
(Note: Based on data for all years, including only cities with at least 500 fire incidents)
| Fleetwood: | 8 minutes |
| Kutztown: | 10 minutes |
| Leesport: | 10 minutes |
| Reading: | 3 minutes |
| Hamburg: | 11 minutes |
| Wyomissing: | 6 minutes |
| Boyertown: | 7 minutes |
| Birdsboro: | 9 minutes |
| Sinking Spring: | 6 minutes |
 34.0% incidents where reported in the morning and 66.0% in the evening. The most fires (18.3%) took place on Saturday, and the least (11.2%) on Thursday.
 According to the 962 incident reports from years 2003 - 2018 most fires (12.9%) took place during March, and the least (5.3%) in June.
 Out of all 2,629 cases reported during the years 2003 - 2018, the most belonged to the categories: Fire (36.6%), Rescue & EMS (19.9%), and Hazardous Condition (15.9%).
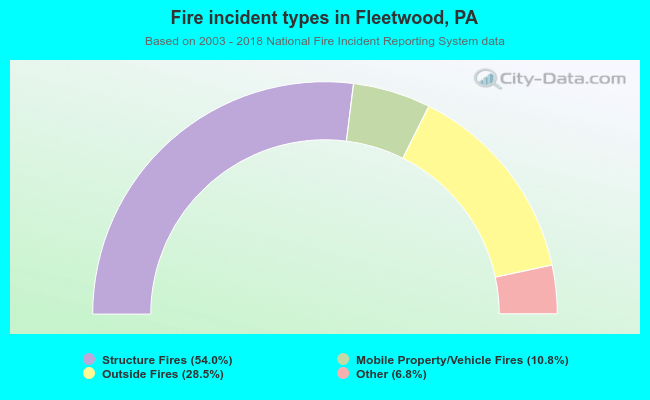 When looking into fire subcategories, the most incidents belonged to: Structure Fires (54.0%), and Outside Fires (28.5%).