Flat Rock: Fire Incidents, Illinois (IL)
Where are fire incidents reported in Flat Rock, IL
Something went wrong! Please refresh the page.
|
| |||||||||||||||||||||||||||||||||||||||||||||||||||||||||||||||||||||||||||||||||||||||||||||||||||||||||||||
| Other | 33 | |||||||||||||||||||||||||||||||||||||||||||||||||||||||||||||||||||||||||||||||||||||||||||||||||||||||||||||
2004 - 2018 National Fire Incident Reporting System (NFIRS) incidents
- Incident types reported to NFIRS in Flat Rock, IL
- 21962.9%Fire
- 5515.8%Rescue & EMS
- 329.2%Hazardous Condition
- 185.2%Good Intent Call
- 92.6%False Alarm
- 61.7%Service Call
- 61.7%Severe Weather
- 20.6%Special Incident
- 10.3%Overpressure Rupture
- Fire incident types reported to NFIRS in Flat Rock, IL
- 11753.4%Outside Fires
- 6931.5%Structure Fires
- 2812.8%Mobile Property/Vehicle Fires
- 52.3%Other
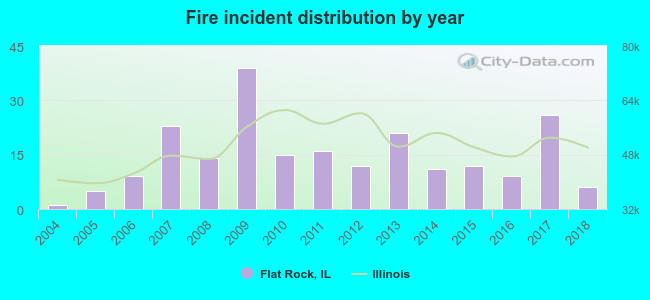 Based on the data from the years 2004 - 2018 the average number of fire incidents per year is 15. The highest number of fire incidents - 39 took place in 2009, and the least - 1 in 2004. The data has an increasing trend.
 22.8% incidents where reported in the morning and 77.2% in the evening. The most fires (26.5%) took place on Saturday, and the least (11.0%) on Thursday.
 According to the 219 fire incident reports from years 2004 - 2018 most fires (14.2%) took place during March, and the least (4.1%) in December.
 Out of all 348 cases reported during the years 2004 - 2018, the most belonged to the categories: Fire (62.9%), Rescue & EMS (15.8%), and Hazardous Condition (9.2%).
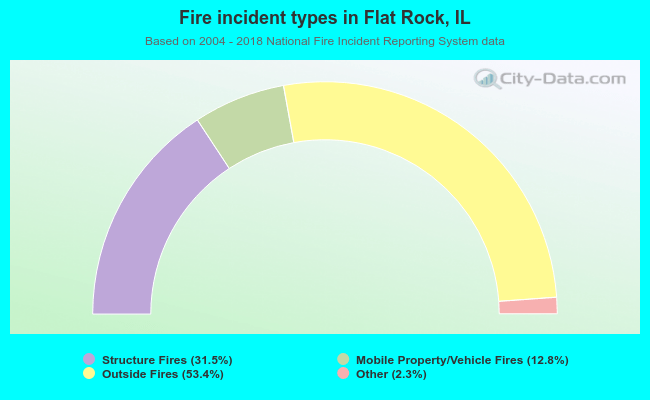 When looking into fire subcategories, the most reports belonged to: Outside Fires (53.4%), and Structure Fires (31.5%).