| Fire incidents reported |
|---|
| Sreet name | Count |
|---|
| 400 E | 6 | | COURT ST | 6 | | 100 EAST RD | 4 | | 1042 E 1900 NORTH RD | 4 | | 1400 N | 4 | | 19569 N 900 E | 4 | | 00E 1850N. LIV.CO. | 2 | | 101 E SOUTH ST | 2 | | 101 SOUTH ADAMS | 2 | | 1042E 1900N | 2 | | 105 FALCON HIGHWAY | 2 | | 117 N. MAIN ST. | 2 | | 1200 N RD | 2 | | 1200 N. 300 EAST RD. | 2 | | 13539 N 700 EAST RD | 2 | | 13702N 200E | 2 | | 14 MILE S 1700 N 400 EAST R | 2 | | 1400 N 00 EAST RD. | 2 | | 1400 N 200 E RD | 2 | | 1400 N 750 E | 2 | | 1400 ROAD | 2 | | 1400N | 2 | | 14854 N 400 EAST RD | 2 | | 150 E RT 116 | 2 | | 1500 HWY | 2 |
| | | Fire incidents reported |
|---|
| Sreet name | Count |
|---|
| 1500 N 1500 EAST RD | 2 | | 1500 N 300 E LIV COUNTY | 2 | | 1500N 600E | 2 | | 15161 N 400 E | 2 | | 1600 N00 EAST RD | 2 | | 16203 N. 300 EAST RD. | 2 | | 16500 N. 200 EAST RD. | 2 | | 17052 N. 400 EAST RD. | 2 | | 1800 E 600 NORTH RD | 2 | | 1800 N 350 E RD | 2 | | 1800 N RD | 2 | | 1800 N. 700 ESAT RD. | 2 | | 1850N 00 E | 2 | | 186887 N. 100 EAST RD. | 2 | | 1900 N | 2 | | 1900 N 185 E | 2 | | 1900 NORTH RD 900 EAST D | 2 | | 1900-N 500-E | 2 | | 1900N 600E | 2 | | 200 E 1300 N | 2 | | 200 E 1400 NORTH RD | 2 | | 200 EAST RD 1400 NORTH | 2 | | 200 NORTH COURT | 2 | | 200B E. EDWARDS | 2 | | |
|
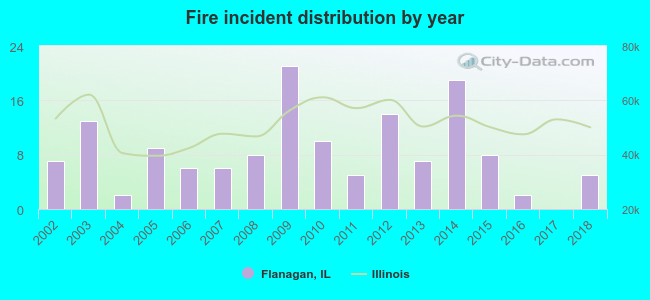 Based on the data from the years 2002 - 2018 the average number of fire incidents per year is 8. The highest number of fire incidents - 21 took place in 2009, and the least - 0 in 2017. The data has a decreasing trend.
 27.5% incidents where reported in the morning and 72.5% in the evening. The most fires (24.6%) took place on Monday, and the least (7.7%) on Thursday.
 According to the 142 fire incident reports from years 2002 - 2018 most fires (14.1%) took place during October, and the least (3.5%) in January.
 Out of all 319 cases reported during the years 2002 - 2018, the most belonged to the categories: Fire (44.5%), Overpressure Rupture (28.8%), and Rescue & EMS (10.3%).
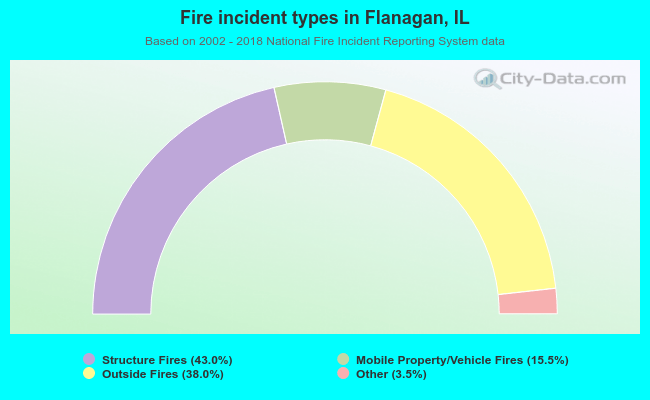 When looking into fire subcategories, the most reports belonged to: Structure Fires (43.0%), and Outside Fires (38.0%).