Flagler Beach: Fire Incidents, Florida (FL)
Where are fire incidents reported in Flagler Beach, FL
Something went wrong! Please refresh the page.
|
| |||||||||||||||||||||||||||||||||||||||||||||||||||||||||||||||||||||||||||||||||||||||||||||||||||||||||||||
2003 - 2018 National Fire Incident Reporting System (NFIRS) incidents
- Incident types reported to NFIRS in Flagler Beach, FL
- 4,30147.0%Rescue & EMS
- 1,82519.9%Service Call
- 1,53616.8%Good Intent Call
- 6867.5%Hazardous Condition
- 4845.3%Fire
- 2833.1%False Alarm
- 270.3%Special Incident
- 160.2%Severe Weather
- Fire incident types reported to NFIRS in Flagler Beach, FL
- 21344.0%Outside Fires
- 18137.4%Structure Fires
- 7315.1%Mobile Property/Vehicle Fires
- 173.5%Other
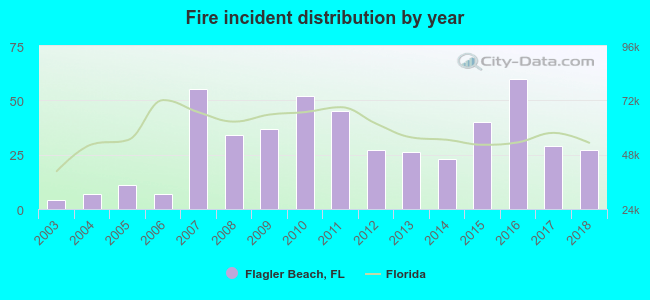 According to the data from the years 2003 - 2018 the average number of fire incidents per year is 30. The highest number of reported fire incidents - 60 took place in 2016, and the least - 4 in 2003. The data has an increasing trend.
 34.9% incidents where reported in the morning and 65.1% in the evening. The most fires (19.2%) took place on Friday, and the least (10.7%) on Thursday.
 Based on the 484 incident reports from years 2003 - 2018 most fires (13.0%) took place during June, and the least (5.8%) in October.
 Out of all 9,159 cases reported during the years 2003 - 2018, the most belonged to the categories: Rescue & EMS (47.0%), Service Call (19.9%), and Good Intent Call (16.8%).
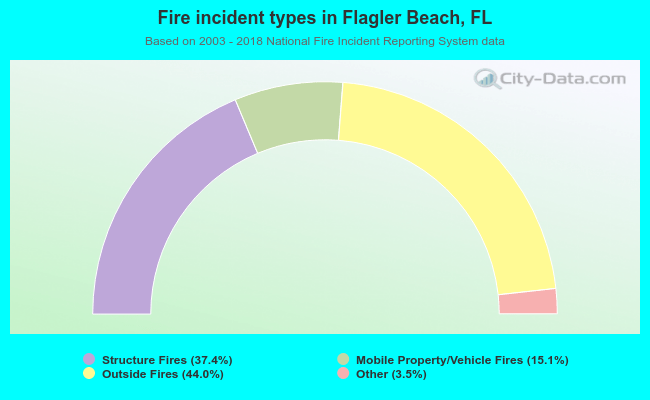 When looking into fire subcategories, the most incidents belonged to: Outside Fires (44.0%), and Structure Fires (37.4%).