| Fire incidents reported |
|---|
| Sreet name | Count |
|---|
| STATE ROUTE 88 | 16 | | STONE CHURCH RD | 14 | | HIDDEN VALLEY DR | 10 | | MCCHAIN RD | 10 | | MINGO CHURCH RD | 10 | | PATTERSON RD | 8 | | MEADOW AVE | 6 | | NASAL LN | 6 | | WASHINGTON AVE | 6 | | CARDOX RD | 4 | | COURTNEY HILL RD | 4 | | JACK ST | 4 | | MINGO PARK EST | 4 | | POWELL LN | 4 | | STATE ROUTE 8824004 | 4 | | THOMPSON ST | 4 | | 136 SR | 2 | | 88 RT | 2 | | ABER RD | 2 | | AIRPORT RD | 2 | | BARR RD | 2 | | BRAWDY ST | 2 | | BROWNSVILLE ROAD EXT | 2 | | CARBOX RD | 2 | | CHEVY CASE | 2 |
| | | Fire incidents reported |
|---|
| Sreet name | Count |
|---|
| CINQUE TERRA PLACE | 2 | | CIRCLE DR | 2 | | DALE | 2 | | DOLLY LN | 2 | | ELRAMA AVE | 2 | | FINLEY ELRAMA (24003) RD | 2 | | FINLEY ELRAMA24003 RD | 2 | | FINLEYELRAMA24001 RD | 2 | | FINLEYVILLE-ELRAMA RD | 2 | | FINLEYVILLEELRAMA RD | 2 | | FRYE AVE | 2 | | GARVIN RD | 2 | | GILMORE ROAD RD | 2 | | GINGER HILL RD | 2 | | GRANITE DR | 2 | | HIDDEN VALLEY DRIVE DR | 2 | | HIDDEN VALLEY RD | 2 | | HILLTOP DR | 2 | | HOUSTON RUN RD | 2 | | HUSTON RUN RD | 2 | | IVY HILL RD | 2 | | KEYSTONE | 2 | | KEYSTONE AVE | 2 | | KEYSTONE RD | 2 | | |
|
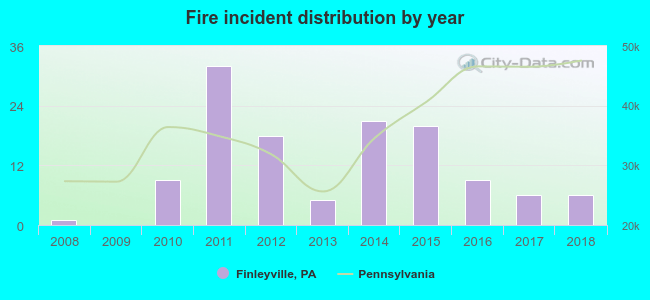 Based on the data from the years 2008 - 2018 the average number of fire incidents per year is 12. The highest number of reported fire incidents - 32 took place in 2011, and the least - 0 in 2009. The data has a rising trend.
 29.1% incidents where reported in the morning and 70.9% in the evening. The most fires (18.1%) took place on Thursday, and the least (9.4%) on Friday.
 Based on the 127 reports from years 2008 - 2018 most fires (15.0%) took place during January, and the least (2.4%) in October.
 Out of all 571 cases reported during the years 2008 - 2018, the most belonged to the categories: Hazardous Condition (27.0%), Fire (22.2%), and Rescue & EMS (22.2%).
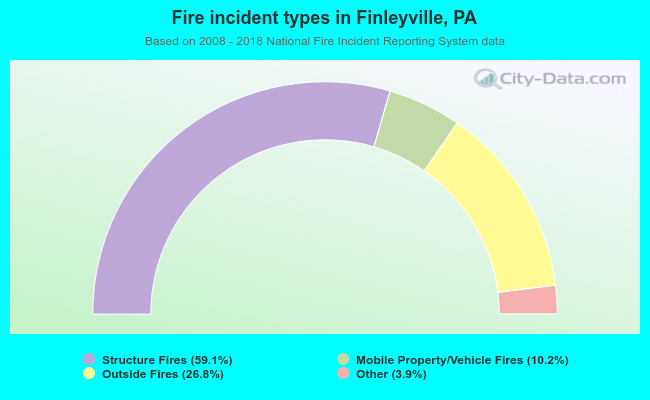 When looking into fire subcategories, the most reports belonged to: Structure Fires (59.1%), and Outside Fires (26.8%).