Findlay: Fire Incidents, Illinois (IL)
Where are fire incidents reported in Findlay, IL
Something went wrong! Please refresh the page.
|
| |||||||||||||||||||||||||||||||||||||||||||||||||||||||||||||||||||||||||||||||||||||||||||||||||||||||||||||
| Other | 134 | |||||||||||||||||||||||||||||||||||||||||||||||||||||||||||||||||||||||||||||||||||||||||||||||||||||||||||||
2003 - 2018 National Fire Incident Reporting System (NFIRS) incidents
- Incident types reported to NFIRS in Findlay, IL
- 27060.0%Fire
- 9220.4%Rescue & EMS
- 306.7%Hazardous Condition
- 214.7%Service Call
- 194.2%Good Intent Call
- 92.0%False Alarm
- 71.6%Severe Weather
- 10.2%Overpressure Rupture
- 10.2%Special Incident
- Fire incident types reported to NFIRS in Findlay, IL
- 11743.3%Outside Fires
- 10639.3%Structure Fires
- 3713.7%Mobile Property/Vehicle Fires
- 103.7%Other
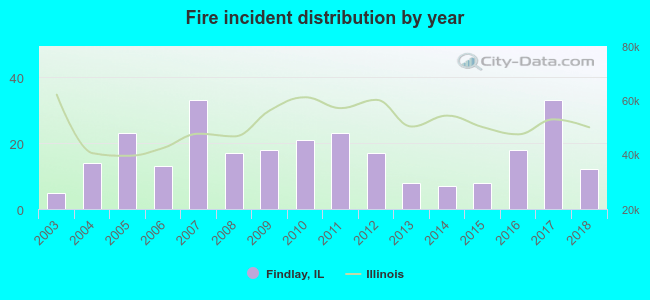 Based on the data from the years 2003 - 2018 the average number of fire incidents per year is 17. The highest number of fire incidents - 33 took place in 2007, and the least - 5 in 2003. The data has an increasing trend.
 31.9% incidents where reported in the morning and 68.1% in the evening. The most fires (20.7%) took place on Saturday, and the least (9.3%) on Tuesday.
 According to the 270 fire incident reports from years 2003 - 2018 most fires (15.2%) took place during September, and the least (1.9%) in May.
 Out of all 450 cases reported during the years 2003 - 2018, the most belonged to the categories: Fire (60.0%), Rescue & EMS (20.4%), and Hazardous Condition (6.7%).
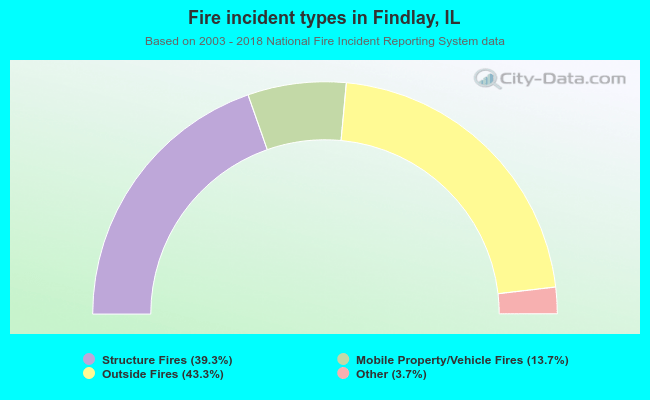 When looking into fire subcategories, the most reports belonged to: Outside Fires (43.3%), and Structure Fires (39.3%).