| Fire incidents reported |
|---|
| Sreet name | Count |
|---|
| HWY 18 | 30 | | HWY 18 HWY | 14 | | HWY 61 HWY | 10 | | LINCOLN AVE | 10 | | BREEZY HILL RD | 8 | | CTY Q | 8 | | HWY 61 | 8 | | CTY K | 6 | | CTY Q RD | 6 | | MT RIDGE RD | 6 | | 14TH ST | 4 | | 1520 13TH ST | 4 | | BREEZY HILL RD | 4 | | CO K | 4 | | COONVALLEY RD | 4 | | GREENRIVER RD | 4 | | HOMER RD | 4 | | LEVEL VALLEY RD | 4 | | ORR RD | 4 | | PLUM VALLEY RD | 4 | | ROGER HOLLOW RD | 4 | | ROGERS HOLLOW RD | 4 | | TORMEY RD | 4 | | WEINBRENNER RD | 4 | | 100 RAYOVAC DR | 2 |
| | | Fire incidents reported |
|---|
| Sreet name | Count |
|---|
| 1035 JEFFERSON ST | 2 | | 1070 8TH ST | 2 | | 11555 MT RIDGE RD | 2 | | 1175 LINCOLN AVE | 2 | | 11TH ST | 2 | | 12 TH ST | 2 | | 12115 HWY 61 SOUTH HWY | 2 | | 12446 CNTY F | 2 | | 12473 ANNATON RD | 2 | | 12492 COUNTY K | 2 | | 12912 HANES LANE | 2 | | 13446 CTY Q. RD | 2 | | 14056 CTY Q | 2 | | 14224 HWY 61 HWY | 2 | | 14286 BLUE SCHOOL RD | 2 | | 14409 HWY 61 HWY | 2 | | 14641 CTY Q | 2 | | 14718 BOWERS RD | 2 | | 15466 COUNTY RD G | 2 | | 15TH ST | 2 | | 1675 9TH ST | 2 | | 1740 MADISON ST | 2 | | 18 HWY | 2 | | 1931 HWY 18 | 2 | | |
|
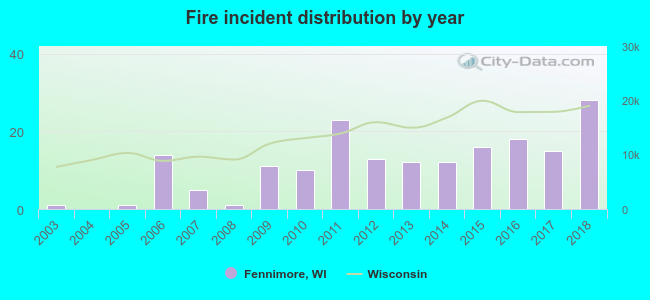 Based on the data from the years 2003 - 2018 the average number of fire incidents per year is 11. The highest number of reported fires - 28 took place in 2018, and the least - 0 in 2004. The data has a rising trend.
 35.0% incidents where reported in the morning and 65.0% in the evening. The most fires (17.8%) took place on Saturday, and the least (7.8%) on Thursday.
 Based on the 180 fires from years 2003 - 2018 most fires (13.9%) took place during April, and the least (5.0%) in June.
 Out of all 382 cases reported during the years 2003 - 2018, the most belonged to the categories: Fire (47.1%), Rescue & EMS (13.6%), and Hazardous Condition (13.1%).
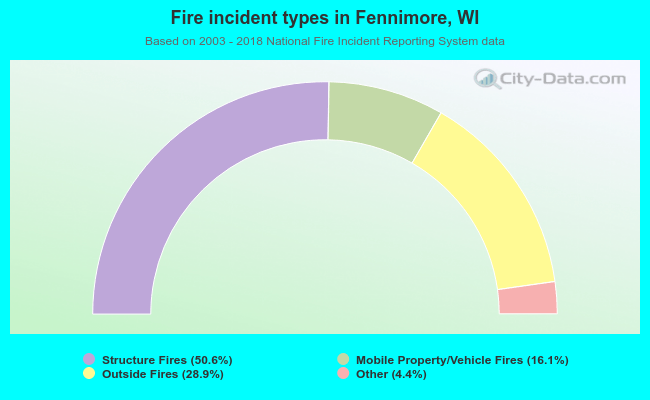 When looking into fire subcategories, the most incidents belonged to: Structure Fires (50.6%), and Outside Fires (28.9%).