Felton: Fire Incidents, California (CA)
Where are fire incidents reported in Felton, CA
Something went wrong! Please refresh the page.
|
| |||||||||||||||||||||||||||||||||||||||||||||||||||||||||||||||||||||||||||||||||||||||||||||||||||||||||||||
2005 - 2018 National Fire Incident Reporting System (NFIRS) incidents
- Incident types reported to NFIRS in Felton, CA
- 1,11142.6%Rescue & EMS
- 43016.5%Hazardous Condition
- 39015.0%Fire
- 35913.8%Good Intent Call
- 2118.1%Service Call
- 963.7%False Alarm
- 60.2%Severe Weather
- 30.1%Special Incident
- Fire incident types reported to NFIRS in Felton, CA
- 13634.9%Outside Fires
- 13033.3%Structure Fires
- 7118.2%Other
- 5313.6%Mobile Property/Vehicle Fires
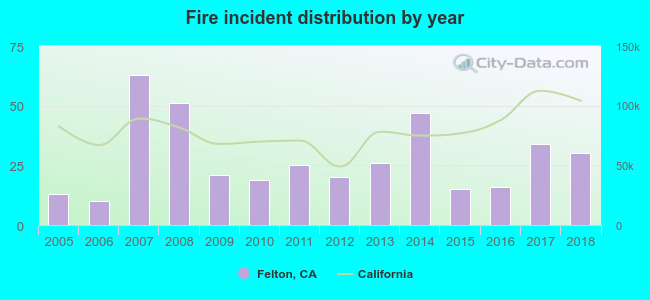 Based on the data from the years 2005 - 2018 the average number of fires per year is 28. The highest number of fire incidents - 63 took place in 2007, and the least - 10 in 2006. The data has an increasing trend.
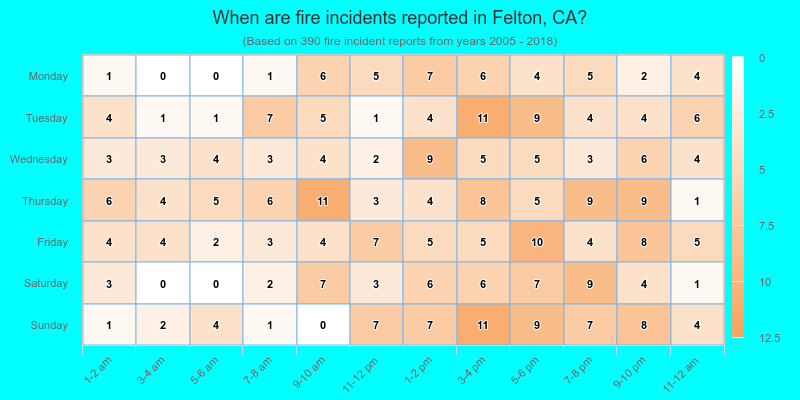
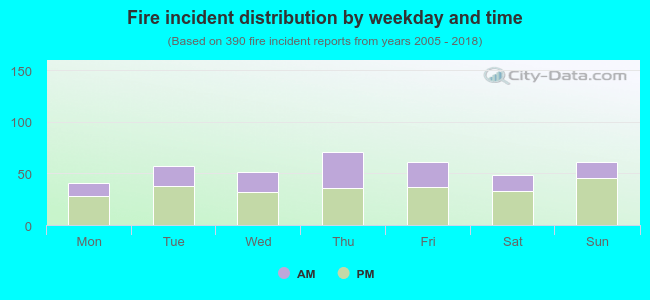 35.9% incidents where reported in the morning and 64.1% in the evening. The most fires (18.2%) took place on Thursday, and the least (10.5%) on Monday.
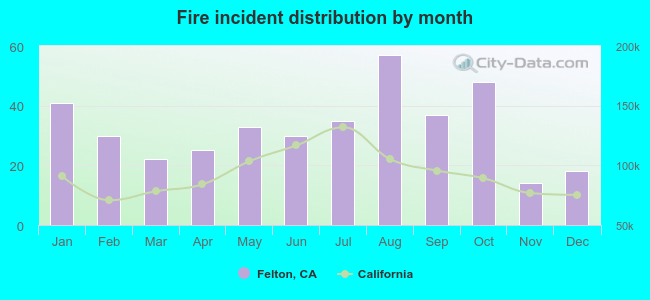 According to the 390 fire incident reports from years 2005 - 2018 most fires (14.6%) took place during August, and the least (3.6%) in November.
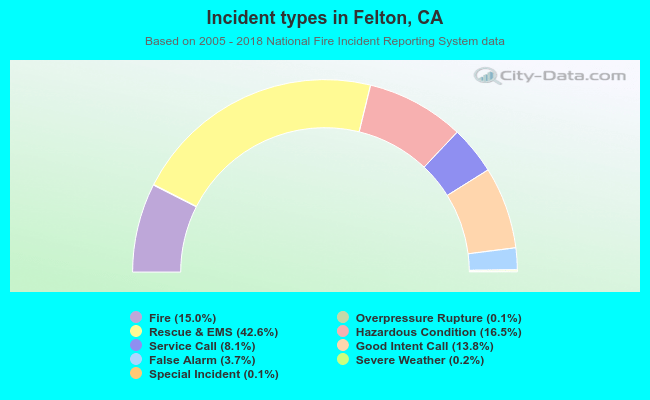 Out of all 2,608 cases reported during the years 2005 - 2018, the most belonged to the categories: Rescue & EMS (42.6%), Hazardous Condition (16.5%), and Fire (15.0%).
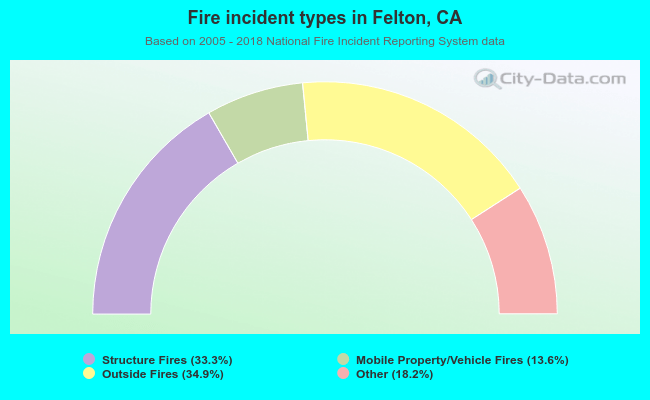 When looking into fire subcategories, the most incidents belonged to: Outside Fires (34.9%), and Structure Fires (33.3%).