Feasterville: Fire Incidents, Pennsylvania (PA)
Where are fire incidents reported in Feasterville, PA
Something went wrong! Please refresh the page.
|
| |||||||||||||||||||||||||||||||||||||||||||||||||||||||||||||||||||||||||||||||||||||||||||||||||||||||||||||
2003 - 2018 National Fire Incident Reporting System (NFIRS) incidents
- Incident types reported to NFIRS in Feasterville, PA
- 17033.1%Fire
- 13225.7%Hazardous Condition
- 12424.2%Good Intent Call
- 519.9%False Alarm
- 234.5%Rescue & EMS
- 132.5%Service Call
- Fire incident types reported to NFIRS in Feasterville, PA
- 11265.9%Structure Fires
- 2514.7%Outside Fires
- 2112.4%Mobile Property/Vehicle Fires
- 127.1%Other
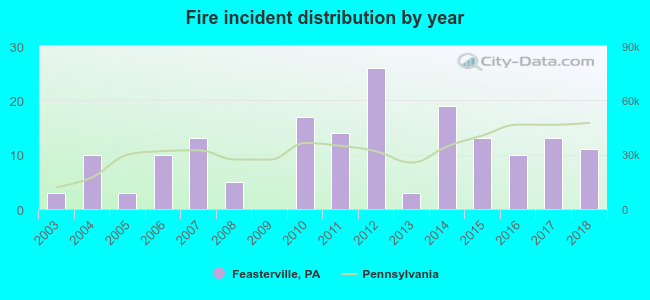 Based on the data from the years 2003 - 2018 the average number of fire incidents per year is 11. The highest number of reported fire incidents - 26 took place in 2012, and the least - 0 in 2009. The data has a rising trend.
 30.0% incidents where reported in the morning and 70.0% in the evening. The most fires (17.1%) took place on Monday, and the least (10.6%) on Wednesday.
 Based on the 170 reports from years 2003 - 2018 most fires (12.4%) took place during February, and the least (3.5%) in July.
 Out of all 513 cases reported during the years 2003 - 2018, the most belonged to the categories: Fire (33.1%), Rescue & EMS (25.7%), and Service Call (24.2%).
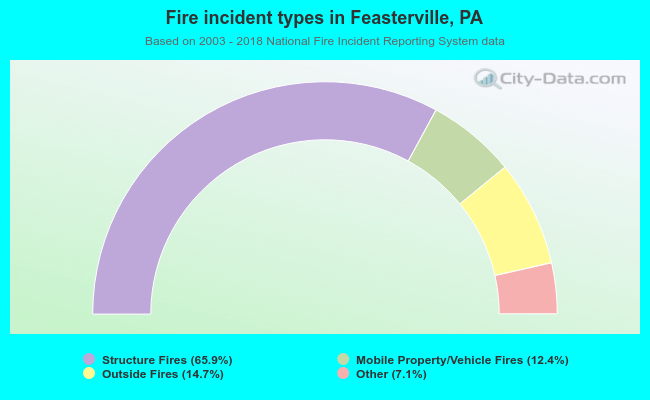 When looking into fire subcategories, the most reports belonged to: Structure Fires (65.9%), and Outside Fires (14.7%).