| Fire incidents reported |
|---|
| Sreet name | Count |
|---|
| CHAMBERSBURG RD | 66 | | LWE | 32 | | LINCOLN (05061-07699) WAY | 28 | | BLACK GAP RD | 26 | | STONE HOUSE CT | 26 | | LINCOLN WAY EAST | 24 | | MONT ALTO (001-2200) RD | 22 | | BLACK GAP (1311-3399) RD | 20 | | LINCOLN (01601-04699) WAY | 20 | | MOUNT UNION (001-399) RD | 18 | | LINCOLN0748710123 WAY | 16 | | MAIN-FAYETTVL 274-426 ST | 16 | | BLACK GAP00011914 RD | 14 | | CHAMBERSBURG (6000-10000) RD | 14 | | LINCOLN WAY | 14 | | MAIN-FAYETTVL 001-248 ST | 14 | | WOODSTOCK (051-3799) RD | 14 | | CHAMBERSBURG600010000 RD | 12 | | COLDSPRING (0001-1299) RD | 12 | | LINCOLN (07700-10123) WAY | 12 | | LOOP ROAD | 12 | | MAINFAYETTVL 001248 ST | 12 | | MONT ALTO RD | 12 | | SOUTH MOUNTAIN RD | 12 | | BLACK GAP (0001-1310) RD | 10 |
| | | Fire incidents reported |
|---|
| Sreet name | Count |
|---|
| BROWNSVILLE (6400-7299) RD | 10 | | COLDSMITH RD | 10 | | HAFER (1800-2899) RD | 10 | | LANDFILL (3100-3699) DR | 10 | | LINCOLN0506107486 WAY | 10 | | MAIN ST | 10 | | MAINFAYETTVL001299 ST | 10 | | WHITE ROCK66007299 RD | 10 | | ANTHONY (00806-02799) HWY | 8 | | ANTHONY HIGHWAY | 8 | | ANTHONY HWY | 8 | | CLUBHOUSE37003899 DR | 8 | | DUFFIELD (4300-6599) RD | 8 | | EBY (1400-2399) RD | 8 | | I-81 EXIT 16 - EXIT 20 LA | 8 | | I-81 EXIT 24 - EXIT 20 LA | 8 | | SOUTH MTN (10059-12499) RD | 8 | | WILKSON (001-1699) LA | 8 | | ANTHONY HWY | 6 | | BROOKENS (500-1099) RD | 6 | | BUCHANAN VALLEY RD | 6 | | CHAMBERSBURG ROAD | 6 | | CHAMBERSBURG ROAD RD | 6 | | CLUBHOUSE (3700-3899) DR | 6 | | |
|
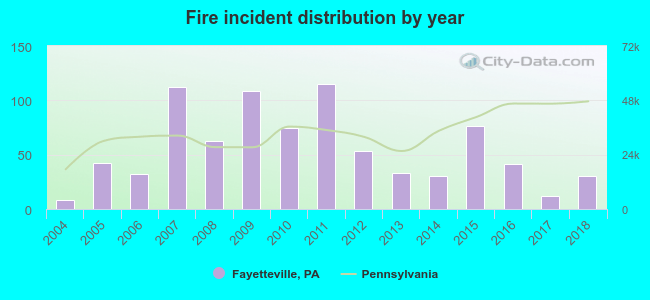 Based on the data from the years 2004 - 2018 the average number of fires per year is 55. The highest number of fire incidents - 115 took place in 2011, and the least - 8 in 2004. The data has an increasing trend.
 The median response time based on all reported fire incidents is 7 minutes. This is close to the state median value.
 30.3% incidents where reported in the morning and 69.7% in the evening. The most fires (18.1%) took place on Monday, and the least (11.3%) on Wednesday.
 According to the 835 fire incident reports from years 2004 - 2018 most fires (12.1%) took place during February, and the least (5.6%) in May.
 Out of all 2,089 cases reported during the years 2004 - 2018, the most belonged to the categories: Hazardous Condition (40.4%), Fire (40.0%), and Rescue & EMS (8.2%).
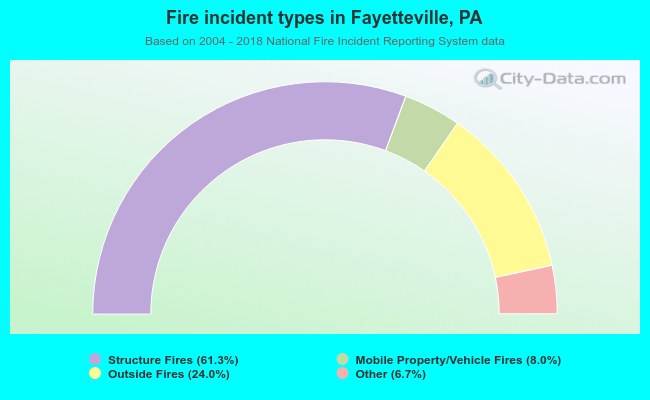 When looking into fire subcategories, the most reports belonged to: Structure Fires (61.3%), and Outside Fires (24.0%).