Farwell: Fire Incidents, Michigan (MI)
Where are fire incidents reported in Farwell, MI
Something went wrong! Please refresh the page.
|
| |||||||||||||||||||||||||||||||||||||||||||||||||||||||||||||||||||||||||||||||||||||||||||||||||||||||||||||
2002 - 2018 National Fire Incident Reporting System (NFIRS) incidents
- Incident types reported to NFIRS in Farwell, MI
- 2,00869.4%Rescue & EMS
- 31610.9%Fire
- 2297.9%Service Call
- 1836.3%Hazardous Condition
- 1174.0%Good Intent Call
- 270.9%False Alarm
- 120.4%Severe Weather
- Fire incident types reported to NFIRS in Farwell, MI
- 17354.7%Structure Fires
- 6821.5%Outside Fires
- 4413.9%Mobile Property/Vehicle Fires
- 319.8%Other
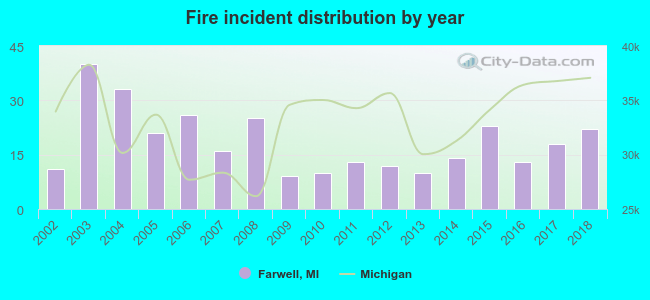 Based on the data from the years 2002 - 2018 the average number of fires per year is 19. The highest number of fire incidents - 40 took place in 2003, and the least - 9 in 2009. The data has a growing trend.
 37.3% incidents where reported in the morning and 62.7% in the evening. The most fires (18.4%) took place on Thursday, and the least (9.8%) on Monday.
 According to the 316 fires from years 2002 - 2018 most fires (15.5%) took place during April, and the least (3.5%) in December.
 Out of all 2,895 cases reported during the years 2002 - 2018, the most belonged to the categories: Rescue & EMS (69.4%), Fire (10.9%), and Service Call (7.9%).
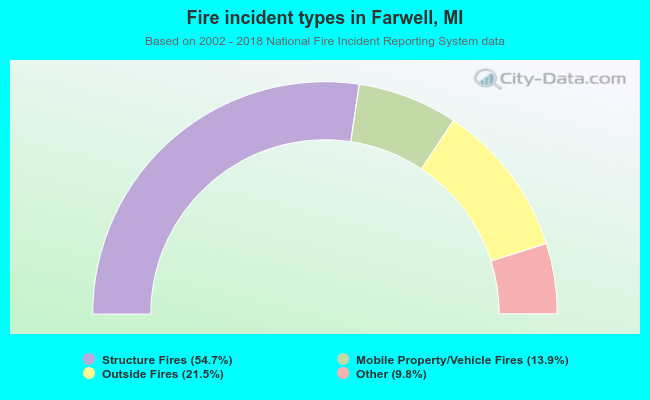 When looking into fire subcategories, the most incidents belonged to: Structure Fires (54.7%), and Outside Fires (21.5%).