Farrell: Fire Incidents, Pennsylvania (PA)
Where are fire incidents reported in Farrell, PA
Something went wrong! Please refresh the page.
|
| |||||||||||||||||||||||||||||||||||||||||||||||||||||||||||||||||||||||||||||||||||||||||||||||||||||||||||||
2003 - 2018 National Fire Incident Reporting System (NFIRS) incidents
- Incident types reported to NFIRS in Farrell, PA
- 34135.2%Service Call
- 21922.6%Fire
- 16216.7%Hazardous Condition
- 879.0%Rescue & EMS
- 848.7%Good Intent Call
- 545.6%False Alarm
- 161.7%Special Incident
- 40.4%Overpressure Rupture
- 10.1%Severe Weather
- Fire incident types reported to NFIRS in Farrell, PA
- 11954.3%Structure Fires
- 4219.2%Outside Fires
- 3817.4%Other
- 209.1%Mobile Property/Vehicle Fires
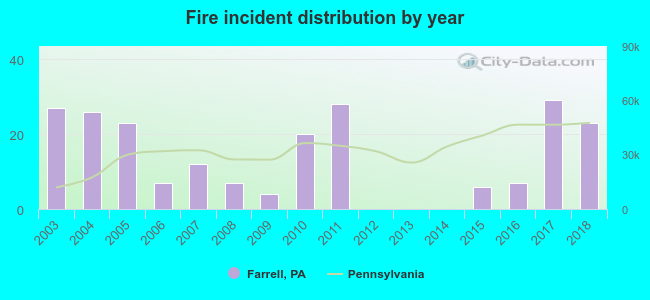 Based on the data from the years 2003 - 2018 the average number of fires per year is 14. The highest number of fire incidents - 29 took place in 2017, and the least - 0 in 2012. The data has a decreasing trend.
 32.0% incidents where reported in the morning and 68.0% in the evening. The most fires (20.1%) took place on Monday, and the least (6.8%) on Wednesday.
 According to the 219 fire incident reports from years 2003 - 2018 most fires (11.9%) took place during September, and the least (3.7%) in August.
 Out of all 968 cases reported during the years 2003 - 2018, the most belonged to the categories: Service Call (35.2%), Fire (22.6%), and Hazardous Condition (16.7%).
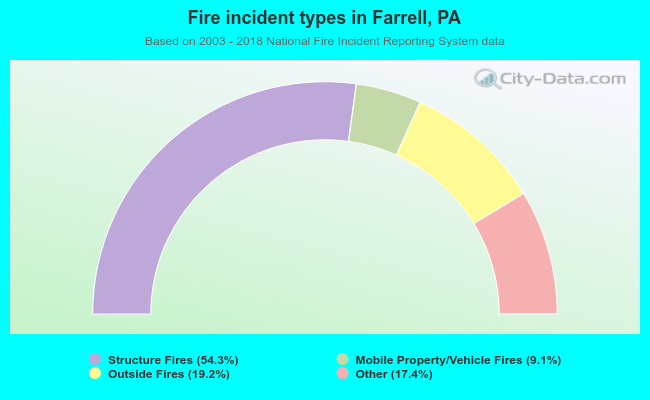 When looking into fire subcategories, the most reports belonged to: Structure Fires (54.3%), and Outside Fires (19.2%).