Farmerville: Fire Incidents, Louisiana (LA)
Where are fire incidents reported in Farmerville, LA
Something went wrong! Please refresh the page.
|
| |||||||||||||||||||||||||||||||||||||||||||||||||||||||||||||||||||||||||||||||||||||||||||||||||||||||||||||
| Other | 220 | |||||||||||||||||||||||||||||||||||||||||||||||||||||||||||||||||||||||||||||||||||||||||||||||||||||||||||||
2002 - 2018 National Fire Incident Reporting System (NFIRS) incidents
- Incident types reported to NFIRS in Farmerville, LA
- 63454.3%Fire
- 28824.7%Rescue & EMS
- 867.4%Service Call
- 857.3%Good Intent Call
- 645.5%Hazardous Condition
- 90.8%False Alarm
- Fire incident types reported to NFIRS in Farmerville, LA
- 27543.4%Outside Fires
- 23837.5%Structure Fires
- 10416.4%Mobile Property/Vehicle Fires
- 172.7%Other
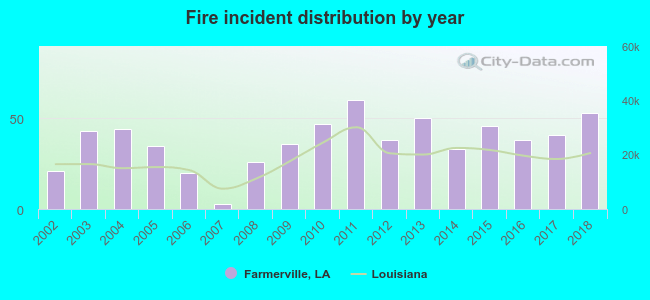 According to the data from the years 2002 - 2018 the average number of fire incidents per year is 37. The highest number of fires - 60 took place in 2011, and the least - 3 in 2007. The data has an increasing trend.
 The median response time based on all reported fire incidents is 7 minutes. This is close to the Louisiana median value.
The median response time in Farmerville, LA compared to nearest cities:
(Note: Based on data for all years, including only cities with at least 500 fire incidents)
| Farmerville: | 7 minutes |
| Dubach: | 9 minutes |
| Choudrant: | 8 minutes |
| Calhoun: | 7 minutes |
| Ruston: | 6 minutes |
| West Monroe: | 6 minutes |
| Monroe: | 5 minutes |
| Simsboro: | 9 minutes |
| Bastrop: | 4 minutes |
 Based on the reports from the years 2002 - 2018 the average number of fire-related yearly deaths is 0. The highest number of deaths - 2 took place in 2014, and the lowest - 0 in 2002. The data has a constant trend.
 36.6% incidents where reported in the morning and 63.4% in the evening. The most fires (17.2%) took place on Saturday, and the least (9.9%) on Wednesday.
 According to the 634 fire incidents from years 2002 - 2018 most fires (13.6%) took place during January, and the least (5.2%) in November.
 Out of all 1,167 cases reported during the years 2002 - 2018, the most belonged to the categories: Fire (54.3%), Overpressure Rupture (24.7%), and Hazardous Condition (7.4%).
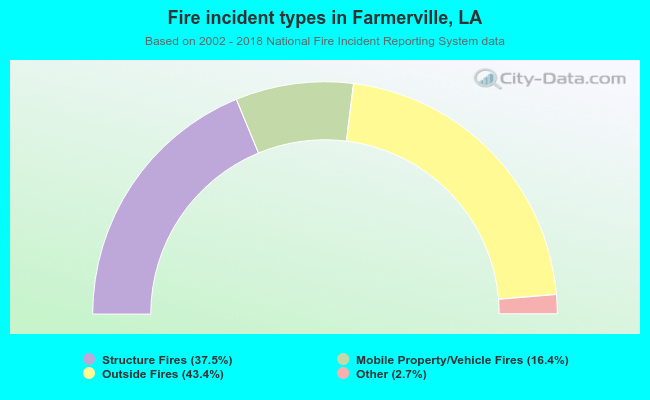 When looking into fire subcategories, the most reports belonged to: Outside Fires (43.4%), and Structure Fires (37.5%).