| Fire incidents reported |
|---|
| Sreet name | Count |
|---|
| CENTER ST | 34 | | CHICKEN BRISTLE RD | 34 | | HEMPLE RD | 34 | | CLAYTON RD | 30 | | FARMERSVILLE/WCARLTON RD | 26 | | DIAMOND MILL RD | 22 | | FARMERSVILLE GRATIS RD | 22 | | FULS RD | 20 | | WALNUT ST | 20 | | DAYTON/FARMERSVILLE RD | 18 | | FARMERSVILLE W ALEX RD | 18 | | ELM ST | 16 | | FARMERSVILLE RD | 14 | | FARMERSVILLE/JOHNSVILLE RD | 14 | | ZEHRING RD | 14 | | HAVERMALE RD | 12 | | LOWER GRATIS RD | 12 | | MANNING RD | 12 | | PREBLE CO LINE RD | 12 | | CHICKEN BRISTLE | 10 | | SWARTZEL RD | 10 | | VENUS RD | 10 | | DAYTON FARMERSVILLE RD | 8 | | DEAN DR | 8 | | FARMERSVILLE/GERMAN RD | 8 |
| | | Fire incidents reported |
|---|
| Sreet name | Count |
|---|
| FARMERSVILLEGERMAN RD | 8 | | FARMERSVILLEJOHNSVILLE RD | 8 | | HEMPLE | 8 | | PREBLE CO. LINE.RD. | 8 | | ANTHONY RD | 6 | | BROADWAY ST | 6 | | PREBLE COUNTY LINE RD | 6 | | WALNUT | 6 | | CENTER | 4 | | CHICKEN BRISTLE RD | 4 | | DEAN | 4 | | FARMERSVILLE GERMANTOWN P | 4 | | FARMERSVILLE GRATIS | 4 | | FARMERSVILLE RD | 4 | | FARMERSVILLEWCARLTON RD | 4 | | LUTHERN CHURCH RD | 4 | | MAIN ST | 4 | | VINE ST | 4 | | 11720 HAVERMALE RD | 2 | | ASHBROOK TR | 2 | | ASHBROOKE | 2 | | BULL RD | 2 | | BULL RD | 2 | | CALIFORNIA ST | 2 | | CAROLYN LN | 2 |
|
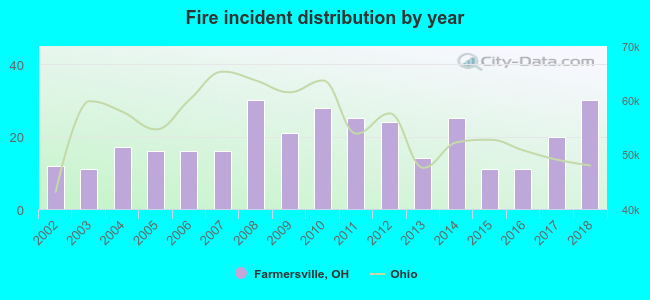 According to the data from the years 2002 - 2018 the average number of fires per year is 19. The highest number of reported fires - 30 took place in 2008, and the least - 11 in 2003. The data has an increasing trend.
 According to the data from the years 2002 - 2018 the average number of fire-related yearly casualties is 1. The highest number of reported casualties - 5 took place in 2012, and the lowest - 0 in 2002. The data has a constant trend.
 30.6% incidents where reported in the morning and 69.4% in the evening. The most fires (18.7%) took place on Tuesday, and the least (11.0%) on Thursday.
 Based on the 327 fire incidents from years 2002 - 2018 most fires (13.8%) took place during April, and the least (5.2%) in January.
 Out of all 1,291 cases reported during the years 2002 - 2018, the most belonged to the categories: Rescue & EMS (33.6%), Fire (25.3%), and Hazardous Condition (19.8%).
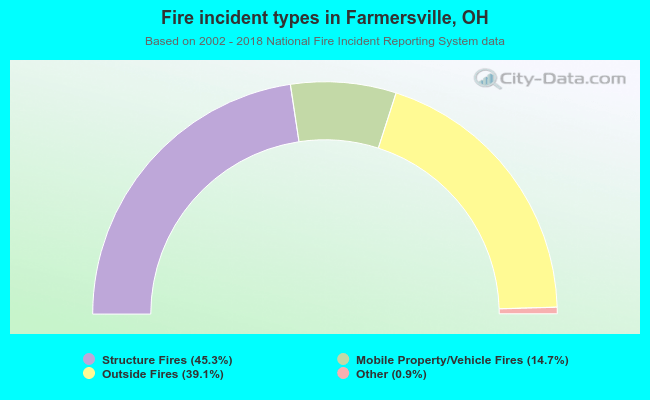 When looking into fire subcategories, the most incidents belonged to: Structure Fires (45.3%), and Outside Fires (39.1%).