| Fire incidents reported |
|---|
| Sreet name | Count |
|---|
| CLINTON AVE | 32 | | MAIN ST | 28 | | JOHN ST | 22 | | GREENLEAF RD | 18 | | WATER ST | 18 | | HIGH ST | 14 | | RICHARDSON ST | 12 | | WILLIAM ST | 10 | | DODGE ST | 6 | | LINCOLN ST | 6 | | MAPLE ST | 6 | | PLUM ST | 6 | | ROYAL RD | 6 | | CLINTON AVE | 4 | | CUMBERLAND RD | 4 | | INDIANA ST | 4 | | MARKET ST | 4 | | OSAGE RD | 4 | | PARNELL RD | 4 | | PRAIRIE CHAPEL RD | 4 | | WOODWARD AVE | 4 | | 100 NORTH RD | 2 | | 1010N | 2 | | 12901 PINE ROAD | 2 | | 1300 W. CLINTON | 2 |
| | | Fire incidents reported |
|---|
| Sreet name | Count |
|---|
| 2100 E. & DEPOT RD | 2 | | 23039 KENNEDY RD | 2 | | 2700 E OLD PRINCIBLE RD | 2 | | 3300E 100NORTH RD | 2 | | 3375 EAST 200 NORTH | 2 | | 35958 E. 200 NORTH RD. | 2 | | 606 NORTH WILLIAMS | 2 | | 622 WEST WATER ST | 2 | | 705 E HIGH ST | 2 | | ALLEN ST | 2 | | BROOKVIEW DRIVE DR | 2 | | BULLARD | 2 | | CEDAR CIRCLE | 2 | | COUNTY RD 2700 | 2 | | COUNTY RD 725 | 2 | | COUNTY ROAD 1030 EAST | 2 | | COUNTY ROAD 3600 EAST | 2 | | DEPOE RD | 2 | | DEPOT ROAD | 2 | | DODGE & MAIN | 2 | | FARMER CITY DISTRICT | 2 | | FARMER CITY RD | 2 | | GRAND RD | 2 | | GREEN LEAF ROAD | 2 | | |
|
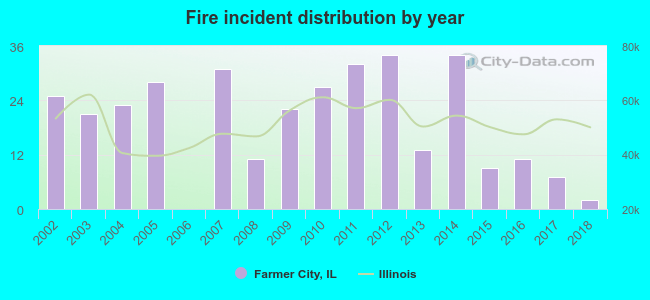 According to the data from the years 2002 - 2018 the average number of fire incidents per year is 19. The highest number of fires - 34 took place in 2012, and the least - 0 in 2006. The data has a declining trend.
 30.6% incidents where reported in the morning and 69.4% in the evening. The most fires (17.3%) took place on Friday, and the least (10.6%) on Thursday.
 Based on the 330 fires from years 2002 - 2018 most fires (17.3%) took place during March, and the least (3.9%) in February.
 Out of all 649 cases reported during the years 2002 - 2018, the most belonged to the categories: Fire (50.8%), Rescue & EMS (18.6%), and Overpressure Rupture (11.2%).
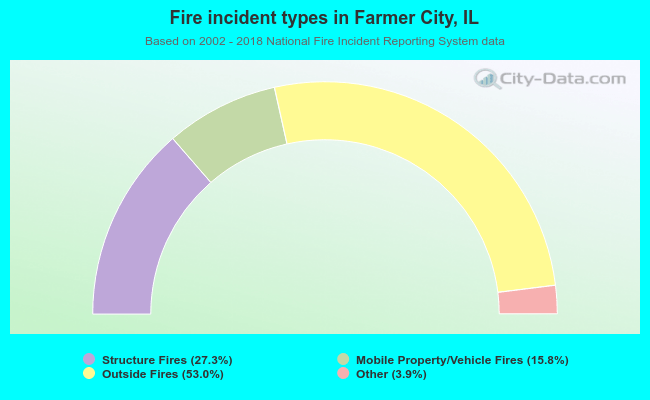 When looking into fire subcategories, the most incidents belonged to: Outside Fires (53.0%), and Structure Fires (27.3%).