| Fire incidents reported |
|---|
| Sreet name | Count |
|---|
| I80 JEFFERSON COUNTY HWY | 8 | | INTERSTATE 80 MM 90 | 8 | | AIRPORT RD | 6 | | OLD GRADE RD | 6 | | STEVENSON HILL RD | 6 | | TAYLOR AVE | 6 | | TAYLOR AVENUE | 6 | | 3RD STREET | 4 | | AIRPORT ROAD | 4 | | FULLER AVE | 4 | | I80 WASHINGTON TWSP HWY | 4 | | KYLE RUN ROAD | 4 | | OLD GRADE ROAD | 4 | | ROUTE 219 | 4 | | SANDSTONE DRIVE | 4 | | 3RD ST | 2 | | 830 RT | 2 | | ALLENS MILLS ROAD | 2 | | AUCTION BARN ROAD | 2 | | BEECHTON ROAD | 2 | | BEECHWOODS ROAD RD | 2 | | BUSKIRK ROAD | 2 | | BUSSARD DR | 2 | | CHAN ROAD | 2 | | COOPER RD | 2 |
| | | Fire incidents reported |
|---|
| Sreet name | Count |
|---|
| DOANE DRIVE | 2 | | FIRST STREET FC | 2 | | FOURTH STREET FC | 2 | | FULLER AVENUE | 2 | | GOSPEL CENTER ROAD | 2 | | HARVEY RUN ROAD | 2 | | HEITZENRIETER ROAD | 2 | | HOLLY ROAD | 2 | | I80 WEST 886 MM | 2 | | INTERSTATE 80 91.5 MM | 2 | | INTERSTATE 80 92 WEST | 2 | | INTERSTATE 80 93MM | 2 | | INTERSTATE 80 95 MM | 2 | | INTERSTATE 80 MM 94 E | 2 | | MAIN ST | 2 | | MAIN ST | 2 | | MCVITTY ROAD | 2 | | MORRIS ROAD | 2 | | NORTH 3RD STREET | 2 | | OSBURN AVENUE | 2 | | OSBURNE AVE | 2 | | PANCOAST ST | 2 | | ROCKDALE RD | 2 | | ROCKDALE ROAD | 2 | | |
|
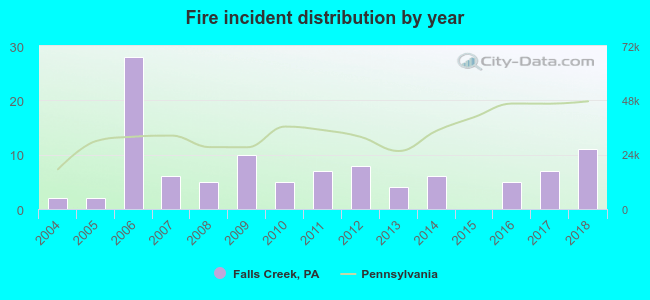 Based on the data from the years 2004 - 2018 the average number of fires per year is 7. The highest number of fire incidents - 28 took place in 2006, and the least - 0 in 2015. The data has an increasing trend.
 36.8% incidents where reported in the morning and 63.2% in the evening. The most fires (21.7%) took place on Monday, and the least (8.5%) on Sunday.
 According to the 106 fire incident reports from years 2004 - 2018 most fires (15.1%) took place during January, and the least (2.8%) in July.
 Out of all 224 cases reported during the years 2004 - 2018, the most belonged to the categories: Fire (47.3%), Overpressure Rupture (20.1%), and Rescue & EMS (14.3%).
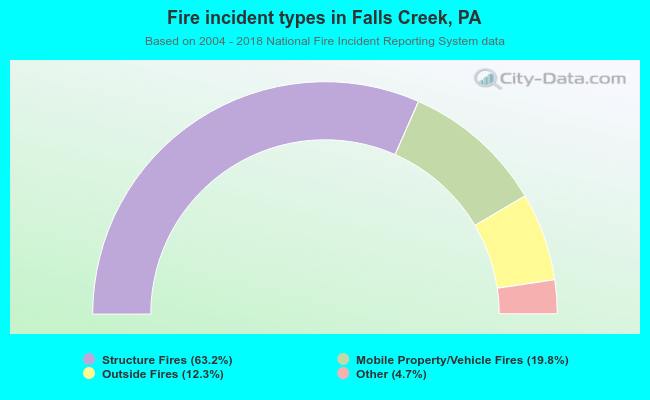 When looking into fire subcategories, the most reports belonged to: Structure Fires (63.2%), and Mobile Property/Vehicle Fires (19.8%).