| Fire incidents reported |
|---|
| Sreet name | Count |
|---|
| 450 QUALITY COURT | 6 | | CNTY A HWY | 6 | | MAIN ST | 6 | | 200 STEELE RD | 4 | | HWY A HWY | 4 | | HWY-Z | 4 | | N3189 LAZY POINT DRIVE | 4 | | W137 PETE REAK ROAD | 4 | | W1556 SAUER RD | 2 | | 101 DUNN STREET | 2 | | 101 HOMETOWN DR | 2 | | 106 SOUTH STREET | 2 | | 108 COMMUNITY DRIVE | 2 | | 135 SOUTH ST | 2 | | 146 HWY | 2 | | 180 DYKSTRA DRIVE | 2 | | 200 STEEL RD | 2 | | 200 STEELE RD | 2 | | 200 STEELE ROAD | 2 | | 207 FOX TRAIL | 2 | | 3195 HWY 73 | 2 | | 341 & 339 FOX TRAIL | 2 | | 431 SOUTH MAIN STREET | 2 | | 538 SOUTH MAIN ST | 2 | | 541 S MAIN STREET | 2 |
| | | Fire incidents reported |
|---|
| Sreet name | Count |
|---|
| 552 NORTH MAIN | 2 | | 640 VITA PLUS DRIVE | 2 | | 669 S MAIN ST | 2 | | A HWY | 2 | | CHURCH ST | 2 | | COMMUNITY DR | 2 | | COUNTY A | 2 | | COUNTY Z | 2 | | CTH CD | 2 | | CTY HWY Z HWY | 2 | | DG CD | 2 | | FIELDS RD RD | 2 | | FIELDS ROAD | 2 | | FOUNTIN RD | 2 | | FOX TR | 2 | | GRADY RD | 2 | | GRADY RD RD | 2 | | HEMLING/RAVEN RD | 2 | | HEPPE RD | 2 | | HIGHWAY 146 & PALMER ROAD | 2 | | HWY 146 HWY | 2 | | HWY 16 | 2 | | HWY 2 | 2 | | HWY 73 | 2 | | HWY Z HWY | 2 |
|
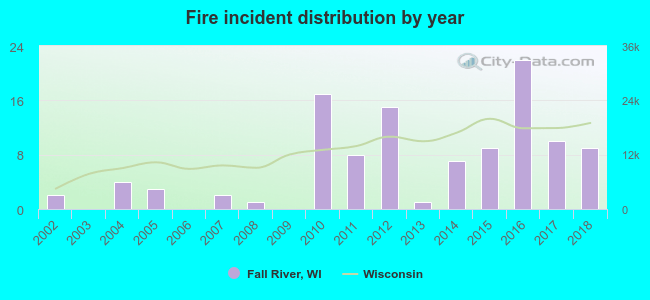 Based on the data from the years 2002 - 2018 the average number of fire incidents per year is 6. The highest number of reported fires - 22 took place in 2016, and the least - 0 in 2003. The data has a rising trend.
 24.5% incidents where reported in the morning and 75.5% in the evening. The most fires (25.5%) took place on Thursday, and the least (6.4%) on Wednesday.
 Based on the 110 fires from years 2002 - 2018 most fires (18.2%) took place during April, and the least (1.8%) in September.
 Out of all 262 cases reported during the years 2002 - 2018, the most belonged to the categories: Fire (42.0%), Rescue & EMS (25.6%), and Hazardous Condition (16.4%).
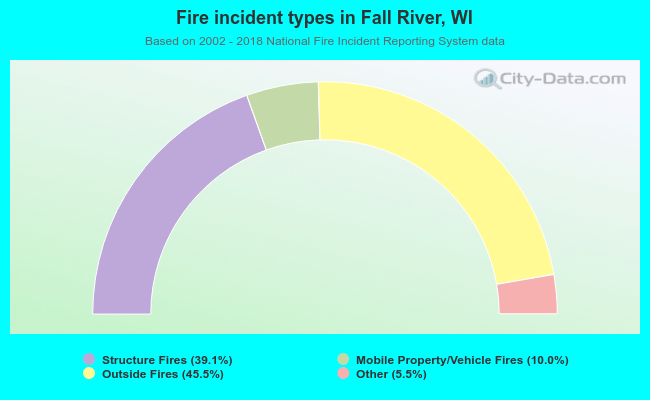 When looking into fire subcategories, the most incidents belonged to: Outside Fires (45.5%), and Structure Fires (39.1%).