Fairport: Fire Incidents, New York (NY)
Where are fire incidents reported in Fairport, NY
Something went wrong! Please refresh the page.
|
| |||||||||||||||||||||||||||||||||||||||||||||||||||||||||||||||||||||||||||||||||||||||||||||||||||||||||||||
| Other | 382 | |||||||||||||||||||||||||||||||||||||||||||||||||||||||||||||||||||||||||||||||||||||||||||||||||||||||||||||
2002 - 2018 National Fire Incident Reporting System (NFIRS) incidents
- Incident types reported to NFIRS in Fairport, NY
- 3,43831.8%Hazardous Condition
- 2,21020.5%Rescue & EMS
- 1,76316.3%False Alarm
- 1,24011.5%Fire
- 1,0069.3%Good Intent Call
- 9508.8%Service Call
- 1000.9%Overpressure Rupture
- 730.7%Severe Weather
- 240.2%Special Incident
- Fire incident types reported to NFIRS in Fairport, NY
- 59047.6%Structure Fires
- 41533.5%Outside Fires
- 12610.2%Mobile Property/Vehicle Fires
- 1098.8%Other
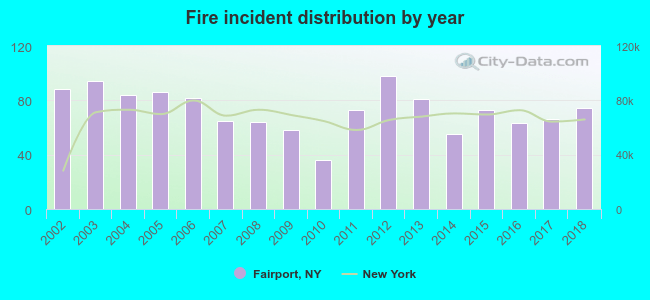 Based on the data from the years 2002 - 2018 the average number of fires per year is 73. The highest number of fires - 98 took place in 2012, and the least - 36 in 2010. The data has a declining trend.
The average number of yearly fire incidents per 10k residents in Fairport, NY compared to nearest cities:
(Note: Based on data for the last 3 years, including only cities with population 5,000 and above)
| Fairport: | 126.0 |
| Perinton: | 2.3 |
| East Rochester: | 31.3 |
| Penfield: | 21.2 |
| Brighton: | 1.6 |
| Walworth: | 17.6 |
| Webster: | 200.8 |
| Henrietta: | 7.2 |
| Rochester: | 93.1 |
 The median response time based on all reported fire incidents is 6 minutes. This is higher compared to the New York median value.
The median response time in Fairport, NY compared to nearest cities:
(Note: Based on data for all years, including only cities with at least 500 fire incidents)
| Fairport: | 6 minutes |
| Pittsford: | 6 minutes |
| Penfield: | 7 minutes |
| Webster: | 6 minutes |
| Victor: | 6 minutes |
| Rochester: | 4 minutes |
| Farmington: | 7 minutes |
| Canandaigua: | 4 minutes |
| Newark: | 5 minutes |
 27.4% incidents where reported in the morning and 72.6% in the evening. The most fires (15.6%) took place on Friday, and the least (12.7%) on Wednesday.
 According to the 1,240 fire incident reports from years 2002 - 2018 most fires (13.6%) took place during June, and the least (5.6%) in February.
 Out of all 10,804 cases reported during the years 2002 - 2018, the most belonged to the categories: Hazardous Condition (31.8%), Rescue & EMS (20.5%), and False Alarm (16.3%).
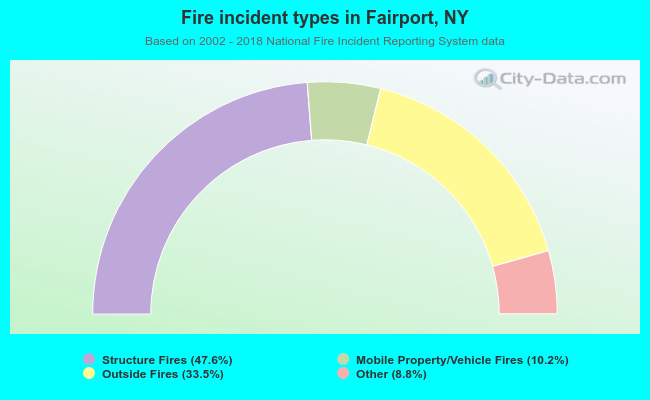 When looking into fire subcategories, the most reports belonged to: Structure Fires (47.6%), and Outside Fires (33.5%).