| Fire incidents reported |
|---|
| Sreet name | Count |
|---|
| LOCUST ST | 10 | | 2400 EAST RD | 8 | | 400 NORTH RD | 8 | | HICKORY | 8 | | 1500 NORTH RD | 6 | | 2200 EAST RD | 6 | | 700N RD | 6 | | JACKSON ST | 6 | | LOCUST | 6 | | OAK | 6 | | OAK ST | 6 | | 1100N RD | 4 | | 1500 RD | 4 | | 2075 EAST RD | 4 | | 2075E RD | 4 | | 2150 RD | 4 | | 23041 E 800 NORTH RD | 4 | | 23041 E. 800 NORTH RD | 4 | | 24191 E 400 NORTH RD | 4 | | 38348 E. 3100 NORTH RD | 4 | | 400 NORTH | 4 | | 501 W ELM STREET | 4 | | 512 E OAK STREET | 4 | | 6444 N. 2400 EAST RD | 4 | | 6792 N 2075 EAST RD | 4 |
| | | Fire incidents reported |
|---|
| Sreet name | Count |
|---|
| HICKORY ST | 4 | | NINTH ST | 4 | | PINE ST | 4 | | 100 W. ASH STREET | 2 | | 1000 N 2 MILES N 2400 EAST RD | 2 | | 1000 NORTH 2400 EAST | 2 | | 1000N 2200 EAST RD | 2 | | 1000N RD | 2 | | 10116 N 1900 EAST RD | 2 | | 10250 N 2315 EAST RD | 2 | | 1069 N. 2300 EAST RD | 2 | | 1069 NORTH 2300 EAST ROAD | 2 | | 107 E WILLOW | 2 | | 107 S. JACKSON ST | 2 | | 1075 N 2200 EAST RD | 2 | | 10750 N 2200 EAST RD | 2 | | 108 E. LOCUST | 2 | | 1100 N 1850 EAST RD | 2 | | 1100 N 2150 EAST RD | 2 | | 118 W LOCUST ST | 2 | | 11934 N 2150 EAST RD | 2 | | 120 S. THIRD ST | 2 | | 1200 N 1800 EAST RD | 2 | | 1200 N 1900 EAST RD | 2 | | |
|
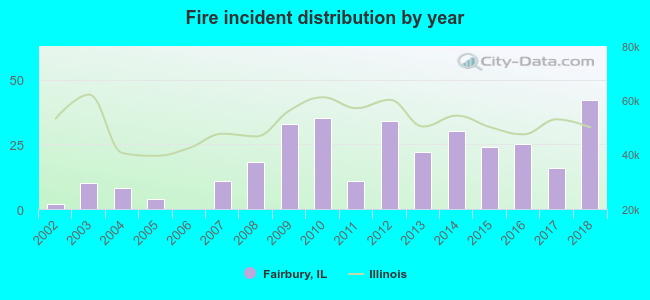 Based on the data from the years 2002 - 2018 the average number of fires per year is 19. The highest number of fire incidents - 42 took place in 2018, and the least - 0 in 2006. The data has an increasing trend.
 28.9% incidents where reported in the morning and 71.1% in the evening. The most fires (16.6%) took place on Wednesday, and the least (12.0%) on Sunday.
 Based on the 325 fire incidents from years 2002 - 2018 most fires (12.3%) took place during July, and the least (4.6%) in March.
 Out of all 574 cases reported during the years 2002 - 2018, the most belonged to the categories: Fire (56.6%), Rescue & EMS (18.1%), and Overpressure Rupture (12.4%).
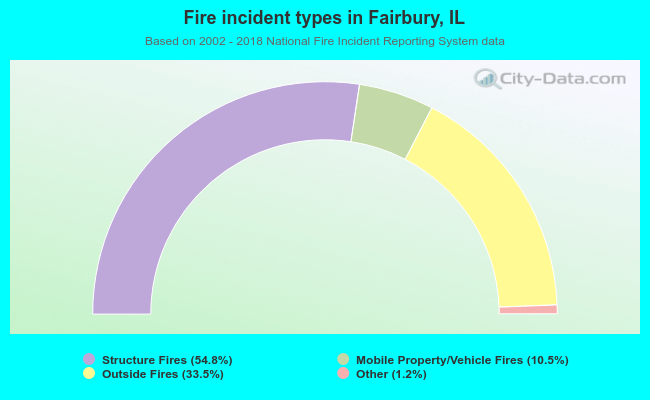 When looking into fire subcategories, the most reports belonged to: Structure Fires (54.8%), and Outside Fires (33.5%).