Fair Lawn: Fire Incidents, New Jersey (NJ)
Where are fire incidents reported in Fair Lawn, NJ
Something went wrong! Please refresh the page.
| Fire incidents reported | |
|---|---|
| Sreet name | Count |
| ROUTE 208 | 100 |
| BROADWAY | 96 |
| FAIR LAWN AVE | 92 |
| RIVER RD | 74 |
| SADDLE RIVER RD | 62 |
| MORLOT AVE | 52 |
| MAPLE AVE | 38 |
| PLAZA RD | 38 |
| LINCOLN AVE | 36 |
| BERDAN AVE | 24 |
| POLLITT DR | 24 |
| WAGARAW RD | 18 |
| 3RD ST | 16 |
| 4TH ST | 16 |
| 6TH ST | 16 |
| BELLAIR AVE | 16 |
| HIGH ST | 16 |
| RYAN RD | 16 |
| 2ND ST | 14 |
| BURBANK ST | 14 |
| HOPPER AVE | 14 |
| LANGAN CT | 14 |
| PHILIP ST | 14 |
| 12TH ST | 12 |
| 27TH ST | 12 |
| EBERLIN DR | 12 |
| HENDERSON BLVD | 12 |
| LYNCREST AVE | 12 |
| RYS TER | 12 |
| WESTMORELAND AVE | 12 |
2002 - 2018 National Fire Incident Reporting System (NFIRS) incidents
- Incident types reported to NFIRS in Fair Lawn, NJ
- 95233.9%Hazardous Condition
- 90132.1%Fire
- 68824.5%False Alarm
- 1415.0%Good Intent Call
- 973.5%Service Call
- 210.7%Rescue & EMS
- 60.2%Overpressure Rupture
- Fire incident types reported to NFIRS in Fair Lawn, NJ
- 56662.8%Structure Fires
- 21323.6%Outside Fires
- 869.5%Mobile Property/Vehicle Fires
- 364.0%Other
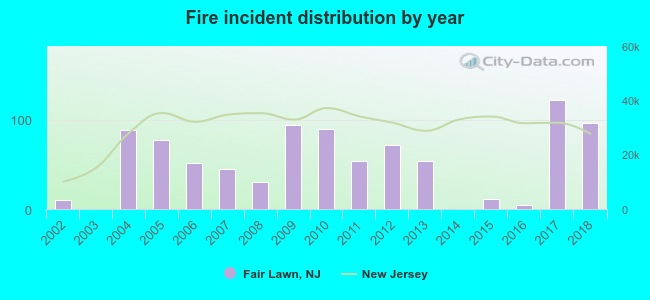 Based on the data from the years 2002 - 2018 the average number of fire incidents per year is 53. The highest number of fires - 122 took place in 2017, and the least - 0 in 2003. The data has a rising trend.
The average number of yearly fire incidents per 10k residents in Fair Lawn, NJ compared to nearest cities:
(Note: Based on data for the last 3 years, including only cities with population 5,000 and above)
| Fair Lawn: | 22.2 |
| Glen Rock: | 27.7 |
| Elmwood Park: | 21.6 |
| Saddle Brook: | 26.1 |
| Paramus: | 4.6 |
| Hawthorne: | 15.5 |
| Paterson: | 52.0 |
| Rochelle Park: | 26.5 |
| Prospect Park: | 16.3 |
 The median response time based on all reported fire incidents is 5 minutes. This is comparable to the New Jersey median value.
The median response time in Fair Lawn, NJ compared to nearest cities:
(Note: Based on data for all years, including only cities with at least 500 fire incidents)
| Fair Lawn: | 5 minutes |
| Elmwood Park: | 5 minutes |
| Hawthorne: | 5 minutes |
| Paterson: | 4 minutes |
| Ridgewood: | 3 minutes |
| Garfield: | 3 minutes |
| Lodi: | 4 minutes |
| Oradell: | 4 minutes |
| Hackensack: | 3 minutes |
 According to the reports from the years 2002 - 2018 the average number of fire-related casualties per year is 0. The highest number of reported casualties - 2 took place in 2004, and the lowest - 0 in 2002. The data has a constant trend.
The average number of injuries per 1,000 fires is 8. This indicator was the highest - 67 in 2008, and the lowest 0 in 2002. The trend for injuries per 1,000 fires is constant. Compared to the New Jersey value the number of casualties per 1,000 fire incidents is lower.
According to the reports from the years 2002 - 2018 the average number of fire-related casualties per year is 0. The highest number of reported casualties - 2 took place in 2004, and the lowest - 0 in 2002. The data has a constant trend.
The average number of injuries per 1,000 fires is 8. This indicator was the highest - 67 in 2008, and the lowest 0 in 2002. The trend for injuries per 1,000 fires is constant. Compared to the New Jersey value the number of casualties per 1,000 fire incidents is lower.Casualties per 1,000 incidents in Fair Lawn, NJ compared to nearest cities:
(Note: Based on data for all years, including only cities with at least 500 fire incidents)
| Fair Lawn: | 6.7 |
| Elmwood Park: | 8.4 |
| Hawthorne: | 5.1 |
| Paterson: | 11.2 |
| Ridgewood: | 9.7 |
| Garfield: | 28.2 |
| Lodi: | 6.3 |
| Oradell: | 25.3 |
| Hackensack: | 13.1 |
 27.0% incidents where reported in the morning and 73.0% in the evening. The most fires (17.9%) took place on Friday, and the least (11.7%) on Sunday.
 Based on the 901 incident reports from years 2002 - 2018 most fires (10.8%) took place during April, and the least (5.8%) in March.
 Out of all 2,806 cases reported during the years 2002 - 2018, the most belonged to the categories: Hazardous Condition (33.9%), Fire (32.1%), and False Alarm (24.5%).
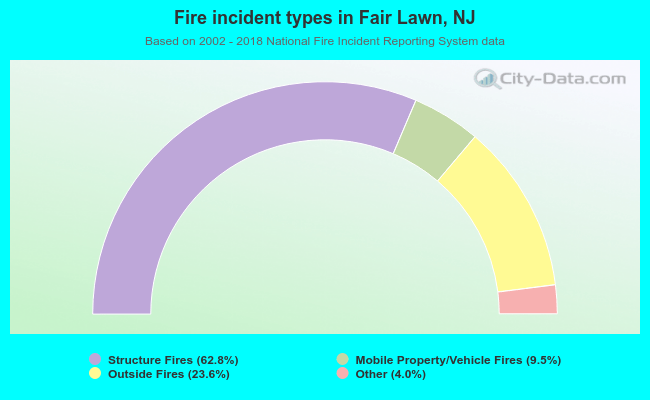 When looking into fire subcategories, the most reports belonged to: Structure Fires (62.8%), and Outside Fires (23.6%).