| Fire incidents reported |
|---|
| Sreet name | Count |
|---|
| EWING RD | 18 | | EWING RD | 14 | | MAIN ST | 14 | | LOG CABIN RD | 12 | | CAMP HOPE RD | 10 | | JORDAN CREEK RD | 10 | | LOG CABIN RD | 10 | | OAK HILL RD | 10 | | CYRIL JAMES RD | 8 | | FRISCO RD | 6 | | N EWING RD | 6 | | N MAIN | 6 | | OAK HILL RD | 6 | | STATE HIGHWAY 37 | 6 | | TICK RIDGE RD | 6 | | WEBB HILL RD | 6 | | 3RD ST | 4 | | CAMP HOPE RD | 4 | | LONG PRAIRE RD | 4 | | N COUNTY LINE RD | 4 | | PINE ST | 4 | | S MAIN | 4 | | SHEEP FARM RD | 4 | | SNOWFLAKE RD | 4 | | 17037 N EWING RD | 2 |
| | | Fire incidents reported |
|---|
| Sreet name | Count |
|---|
| BENTON LAKE RD | 2 | | BROWNING LN | 2 | | CAMP HOPE RD | 2 | | CHAPEL CHURCH RD | 2 | | COLLEGE | 2 | | CONNER RD | 2 | | CYRIL JAMES RD | 2 | | E FRANKLIN RD | 2 | | FRANKLIN COUNTY RD | 2 | | FRANKLIN RD | 2 | | FREEWAY LANE. | 2 | | FRISCO | 2 | | JORDAN CREEK RD | 2 | | KEARNEY RD | 2 | | KETTEMAN RD | 2 | | LAKE BENTON RD | 2 | | LOG CABIN LANE ROAD | 2 | | LONG PRAIRE RD | 2 | | MAIN | 2 | | MC DOWELL RD | 2 | | N THOMPSONVILLE | 2 | | NORTH COUNTY LINE RD | 2 | | OAKHILL RD | 2 | | OLD LAKE RD | 2 | | OTTERSON RD | 2 |
|
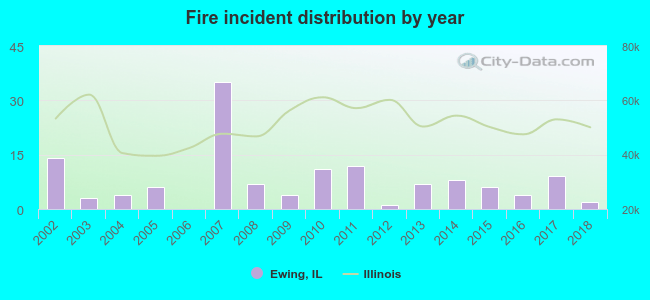 Based on the data from the years 2002 - 2018 the average number of fires per year is 8. The highest number of fire incidents - 35 took place in 2007, and the least - 0 in 2006. The data has a decreasing trend.
 30.8% incidents where reported in the morning and 69.2% in the evening. The most fires (18.0%) took place on Friday, and the least (8.3%) on Monday.
 Based on the 133 fire incidents from years 2002 - 2018 most fires (21.8%) took place during March, and the least (1.5%) in December.
 Out of all 159 cases reported during the years 2002 - 2018, the most belonged to the categories: Fire (83.6%), Overpressure Rupture (6.3%), and Rescue & EMS (6.3%).
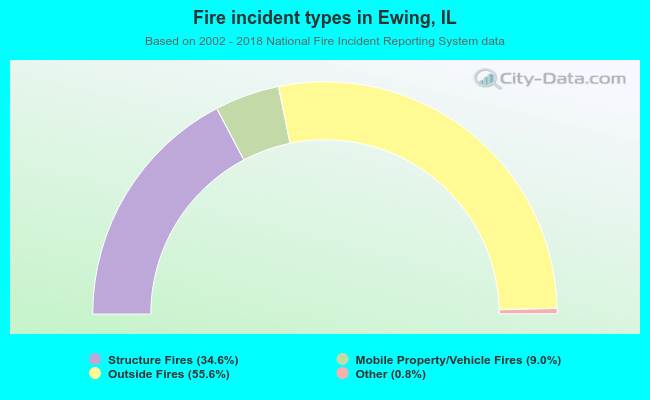 When looking into fire subcategories, the most reports belonged to: Outside Fires (55.6%), and Structure Fires (34.6%).