Everett: Fire Incidents, Massachusetts (MA)
Where are fire incidents reported in Everett, MA
Something went wrong! Please refresh the page.
| Fire incidents reported | |
|---|---|
| Sreet name | Count |
| BROADWAY ST | 494 |
| ROVER ST | 236 |
| FERRY ST | 222 |
| MAIN ST | 134 |
| REVERE BEACH PW | 110 |
| CHELSEA ST | 100 |
| ELM ST | 90 |
| MYSTIC VIEW RD | 90 |
| HANCOCK ST | 74 |
| BOSTON ST | 70 |
| GARLAND ST | 68 |
| SWEETZER CR | 68 |
| LINDEN ST | 64 |
| SCHOOL ST | 60 |
| RUSSELL ST | 52 |
| BOW ST | 46 |
| VERNAL ST | 42 |
| SHUTE ST | 40 |
| CHARLTON ST | 38 |
| NORMAN ST | 38 |
| REVERE BEACH | 38 |
| BEACHAM ST | 36 |
| EDITH ST | 36 |
| GLENDALE ST | 36 |
| SECOND ST | 36 |
| CHESTNUT ST | 34 |
| COTTAGE ST | 32 |
| IRVING ST | 32 |
| FULLER ST | 30 |
| FLORENCE ST | 28 |
| Other | 23 |
2002 - 2018 National Fire Incident Reporting System (NFIRS) incidents
- Incident types reported to NFIRS in Everett, MA
- 14,05054.9%Rescue & EMS
- 3,48913.6%False Alarm
- 2,4979.7%Fire
- 2,1378.3%Hazardous Condition
- 1,8317.1%Good Intent Call
- 1,5316.0%Service Call
- 340.1%Special Incident
- 260.1%Severe Weather
- Fire incident types reported to NFIRS in Everett, MA
- 1,30652.3%Structure Fires
- 80232.1%Outside Fires
- 33913.6%Mobile Property/Vehicle Fires
- 502.0%Other
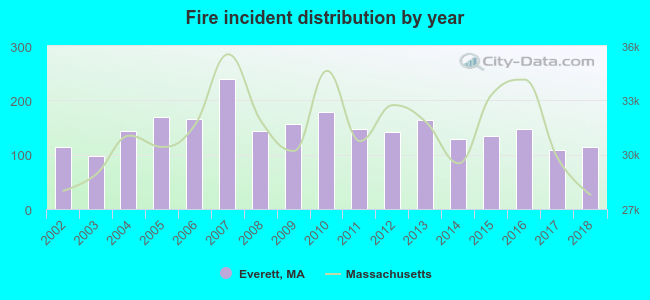 Based on the data from the years 2002 - 2018 the average number of fires per year is 147. The highest number of fires - 239 took place in 2007, and the least - 98 in 2003. The data has a constant trend.
The average number of yearly fire incidents per 10k residents in Everett, MA compared to nearest cities:
(Note: Based on data for the last 3 years, including only cities with population 5,000 and above)
| Everett: | 27.9 |
| Chelsea: | 76.9 |
| Malden: | 22.3 |
| Revere: | 68.1 |
| Medford: | 41.3 |
| Somerville: | 56.2 |
| Melrose: | 6.6 |
| Cambridge: | 99.2 |
| Saugus: | 48.2 |
 The median response time based on all reported fire incidents is 2 minutes. This is much lower than the state median value.
The median response time in Everett, MA compared to nearest cities:
(Note: Based on data for all years, including only cities with at least 500 fire incidents)
| Everett: | 2 minutes |
| Chelsea: | 3 minutes |
| Malden: | 3 minutes |
| Revere: | 3 minutes |
| Medford: | 3 minutes |
| Somerville: | 3 minutes |
| Cambridge: | 5 minutes |
| Saugus: | 5 minutes |
| Winthrop: | 3 minutes |
 Based on the data from the years 2002 - 2018 the average number of fire-related yearly casualties is 3. The highest number of reported casualties - 8 took place in 2002, and the lowest - 0 in 2003. The data has a declining trend.
The average number of casualties per 1,000 fire incidents is 18. This indicator was the highest - 70 in 2002, and the lowest 0 in 2003. The trend for casualties per 1,000 incidents is decreasing. Compared to the state value the number of injuries per 1,000 incidents is higher.
Based on the data from the years 2002 - 2018 the average number of fire-related yearly casualties is 3. The highest number of reported casualties - 8 took place in 2002, and the lowest - 0 in 2003. The data has a declining trend.
The average number of casualties per 1,000 fire incidents is 18. This indicator was the highest - 70 in 2002, and the lowest 0 in 2003. The trend for casualties per 1,000 incidents is decreasing. Compared to the state value the number of injuries per 1,000 incidents is higher.
 34.2% incidents where reported in the morning and 65.8% in the evening. The most fires (15.2%) took place on Wednesday, and the least (13.2%) on Saturday.
 According to the 2,497 reports from years 2002 - 2018 most fires (10.2%) took place during April, and the least (6.5%) in November.
 Out of all 25,613 cases reported during the years 2002 - 2018, the most belonged to the categories: Rescue & EMS (54.9%), False Alarm (13.6%), and Fire (9.7%).
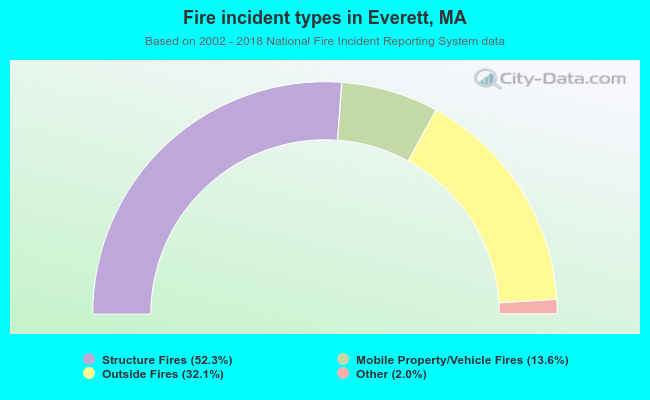 When looking into fire subcategories, the most incidents belonged to: Structure Fires (52.3%), and Outside Fires (32.1%).