Evarts: Fire Incidents, Kentucky (KY)
Where are fire incidents reported in Evarts, KY
Something went wrong! Please refresh the page.
|
| |||||||||||||||||||||||||||||||||||||||||||||||||||||||||||||||||||||||||||||||||||||||||||||||||||||||||||||
| Other | 36 | |||||||||||||||||||||||||||||||||||||||||||||||||||||||||||||||||||||||||||||||||||||||||||||||||||||||||||||
2002 - 2018 National Fire Incident Reporting System (NFIRS) incidents
- Incident types reported to NFIRS in Evarts, KY
- 20654.4%Fire
- 6015.8%Rescue & EMS
- 5715.0%Service Call
- 184.7%Severe Weather
- 143.7%Hazardous Condition
- 133.4%False Alarm
- 82.1%Good Intent Call
- 30.8%Special Incident
- Fire incident types reported to NFIRS in Evarts, KY
- 12058.3%Structure Fires
- 4119.9%Outside Fires
- 2914.1%Other
- 167.8%Mobile Property/Vehicle Fires
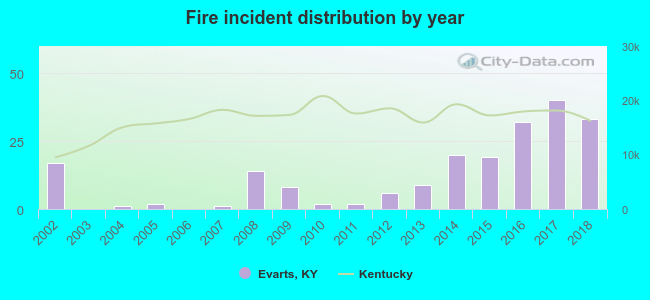 According to the data from the years 2002 - 2018 the average number of fire incidents per year is 12. The highest number of reported fires - 40 took place in 2017, and the least - 0 in 2003. The data has a growing trend.
 Based on the data from the years 2002 - 2018 the average number of fire-related yearly casualties is 0. The highest number of injuries - 1 took place in 2007, and the lowest - 0 in 2002. The data has a constant trend.
 33.0% incidents where reported in the morning and 67.0% in the evening. The most fires (20.9%) took place on Monday, and the least (9.2%) on Tuesday.
 According to the 206 fire incident reports from years 2002 - 2018 most fires (12.6%) took place during September, and the least (1.9%) in August.
 Out of all 379 cases reported during the years 2002 - 2018, the most belonged to the categories: Fire (54.4%), Overpressure Rupture (15.8%), and Hazardous Condition (15.0%).
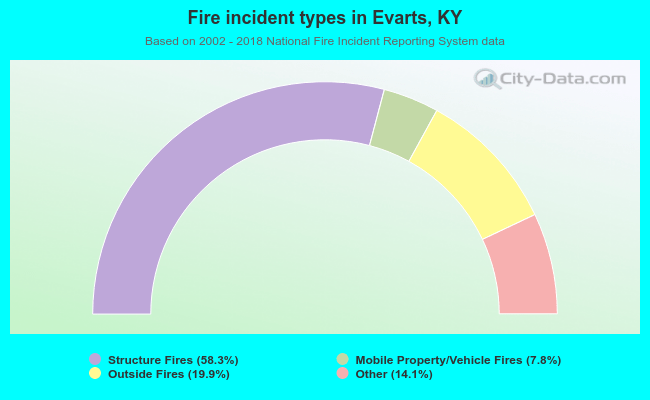 When looking into fire subcategories, the most reports belonged to: Structure Fires (58.3%), and Outside Fires (19.9%).