Evart: Fire Incidents, Michigan (MI)
Where are fire incidents reported in Evart, MI
Something went wrong! Please refresh the page.
|
| |||||||||||||||||||||||||||||||||||||||||||||||||||||||||||||||||||||||||||||||||||||||||||||||||||||||||||||
2002 - 2018 National Fire Incident Reporting System (NFIRS) incidents
- Incident types reported to NFIRS in Evart, MI
- 1,24849.8%Rescue & EMS
- 46918.7%Fire
- 39215.7%Hazardous Condition
- 2499.9%Good Intent Call
- 592.4%False Alarm
- 481.9%Service Call
- 391.6%Special Incident
- Fire incident types reported to NFIRS in Evart, MI
- 22548.0%Structure Fires
- 15633.3%Outside Fires
- 5912.6%Mobile Property/Vehicle Fires
- 296.2%Other
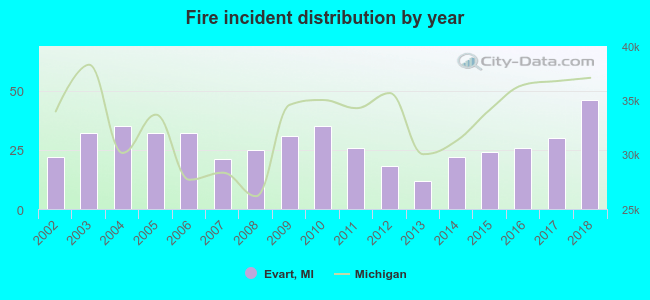 Based on the data from the years 2002 - 2018 the average number of fires per year is 28. The highest number of fires - 46 took place in 2018, and the least - 12 in 2013. The data has a growing trend.
 Based on the data from the years 2002 - 2018 the average number of fire-related yearly casualties is 0. The highest number of casualties - 2 took place in 2010, and the lowest - 0 in 2002. The data has a rising trend.
 27.9% incidents where reported in the morning and 72.1% in the evening. The most fires (17.9%) took place on Wednesday, and the least (10.9%) on Friday.
 According to the 469 fire incidents from years 2002 - 2018 most fires (15.1%) took place during April, and the least (5.5%) in October.
 Out of all 2,504 cases reported during the years 2002 - 2018, the most belonged to the categories: Overpressure Rupture (49.8%), Fire (18.7%), and Rescue & EMS (15.7%).
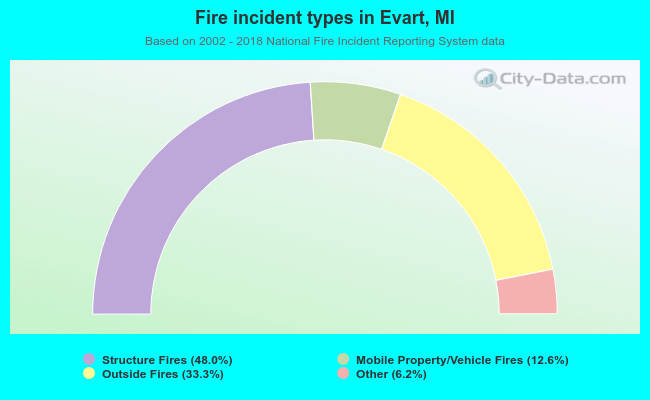 When looking into fire subcategories, the most incidents belonged to: Structure Fires (48.0%), and Outside Fires (33.3%).