Evanston: Fire Incidents, Wyoming (WY)
Where are fire incidents reported in Evanston, WY
Something went wrong! Please refresh the page.
|
| |||||||||||||||||||||||||||||||||||||||||||||||||||||||||||||||||||||||||||||||||||||||||||||||||||||||||||||
| Other | 220 | |||||||||||||||||||||||||||||||||||||||||||||||||||||||||||||||||||||||||||||||||||||||||||||||||||||||||||||
2002 - 2018 National Fire Incident Reporting System (NFIRS) incidents
- Incident types reported to NFIRS in Evanston, WY
- 75641.6%Fire
- 45024.8%Hazardous Condition
- 20111.1%Rescue & EMS
- 1789.8%False Alarm
- 1236.8%Good Intent Call
- 834.6%Service Call
- 170.9%Special Incident
- 60.3%Overpressure Rupture
- 30.2%Severe Weather
- Fire incident types reported to NFIRS in Evanston, WY
- 37048.9%Outside Fires
- 21628.6%Structure Fires
- 15820.9%Mobile Property/Vehicle Fires
- 121.6%Other
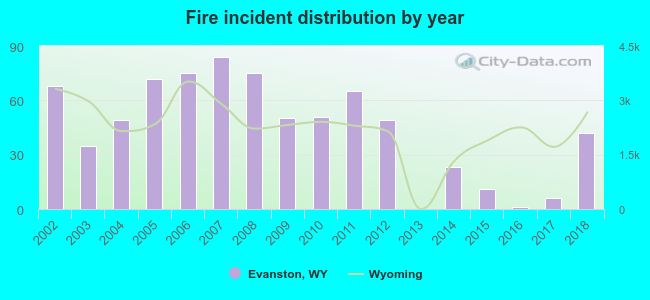 Based on the data from the years 2002 - 2018 the average number of fires per year is 44. The highest number of fire incidents - 84 took place in 2007, and the least - 0 in 2013. The data has a decreasing trend.
The average number of yearly fire incidents per 10k residents in Evanston, WY compared to nearest cities:
(Note: Based on data for the last 3 years, including only cities with population 5,000 and above)
| Evanston: | 13.4 |
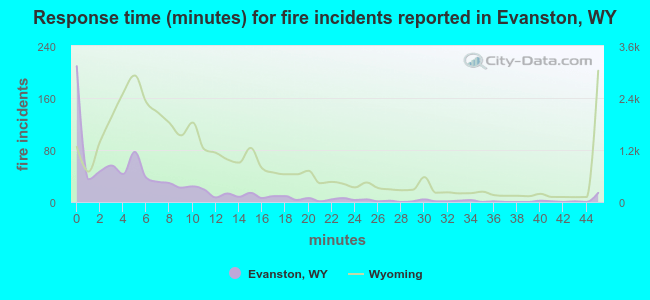 The median response time based on all reported fire incidents is 4 minutes. This is much lower compared to the state median value.
The median response time in Evanston, WY compared to nearest cities:
(Note: Based on data for all years, including only cities with at least 500 fire incidents)
| Evanston: | 4 minutes |
| Park City: | 6 minutes |
| Ogden: | 6 minutes |
| Farmington: | 7 minutes |
| Kaysville: | 6 minutes |
| Layton: | 6 minutes |
| Bountiful: | 5 minutes |
| Riverdale: | 6 minutes |
| Logan: | 5 minutes |
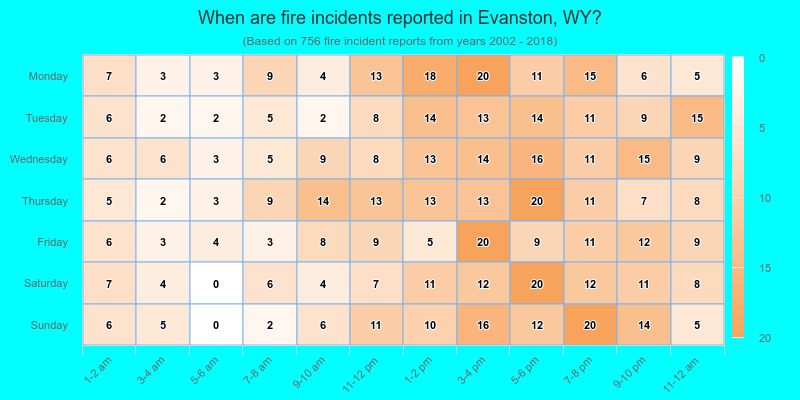
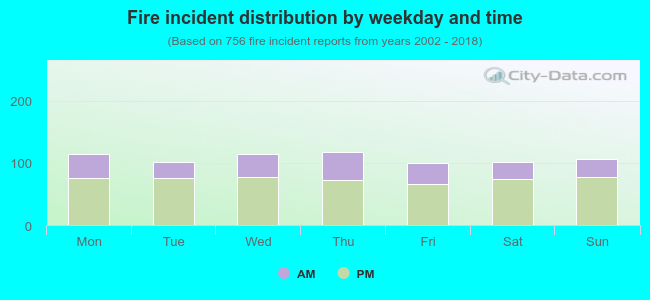 31.5% incidents where reported in the morning and 68.5% in the evening. The most fires (15.6%) took place on Thursday, and the least (13.1%) on Friday.
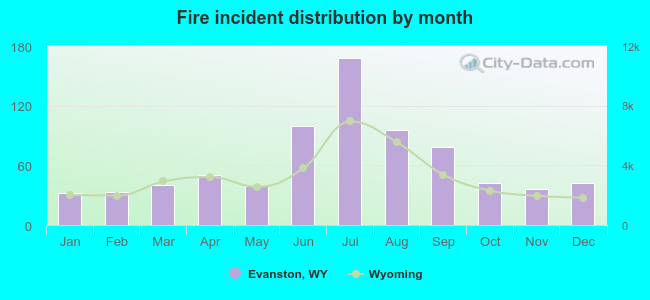 Based on the 756 incident reports from years 2002 - 2018 most fires (22.2%) took place during July, and the least (4.2%) in January.
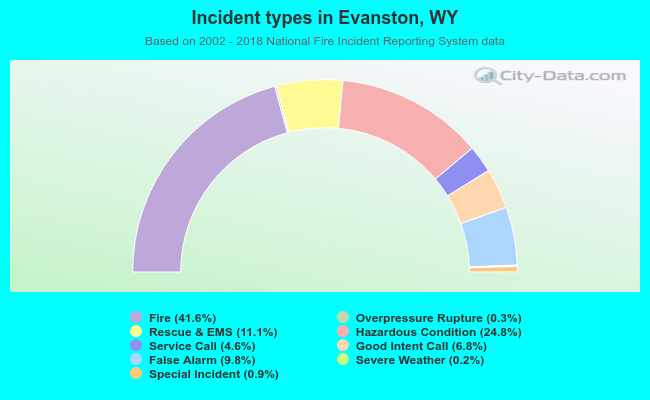 Out of all 1,817 cases reported during the years 2002 - 2018, the most belonged to the categories: Fire (41.6%), Hazardous Condition (24.8%), and Rescue & EMS (11.1%).
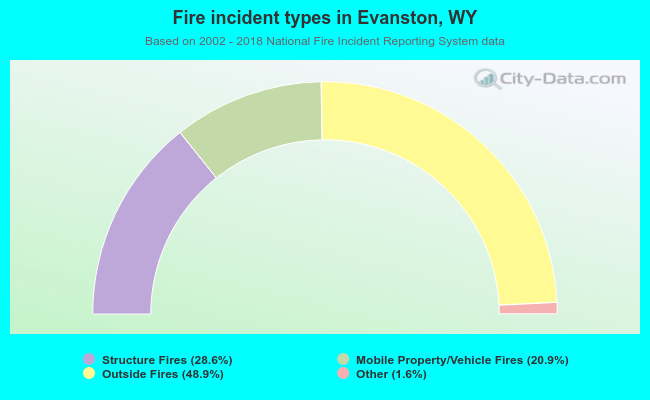 When looking into fire subcategories, the most reports belonged to: Outside Fires (48.9%), and Structure Fires (28.6%).