Etowah: Fire Incidents, Tennessee (TN)
Where are fire incidents reported in Etowah, TN
Something went wrong! Please refresh the page.
|
| |||||||||||||||||||||||||||||||||||||||||||||||||||||||||||||||||||||||||||||||||||||||||||||||||||||||||||||
| Other | 488 | |||||||||||||||||||||||||||||||||||||||||||||||||||||||||||||||||||||||||||||||||||||||||||||||||||||||||||||
2002 - 2018 National Fire Incident Reporting System (NFIRS) incidents
- Incident types reported to NFIRS in Etowah, TN
- 1,73242.4%Rescue & EMS
- 1,30031.8%Fire
- 3939.6%Hazardous Condition
- 3498.5%Good Intent Call
- 1924.7%False Alarm
- 1102.7%Service Call
- 70.2%Special Incident
- Fire incident types reported to NFIRS in Etowah, TN
- 57644.3%Structure Fires
- 52140.1%Outside Fires
- 16112.4%Mobile Property/Vehicle Fires
- 423.2%Other
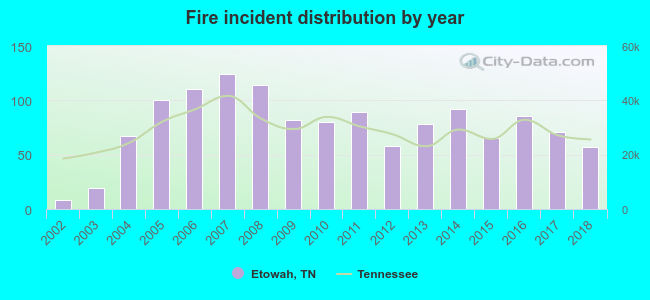 Based on the data from the years 2002 - 2018 the average number of fires per year is 76. The highest number of fire incidents - 124 took place in 2007, and the least - 8 in 2002. The data has a growing trend.
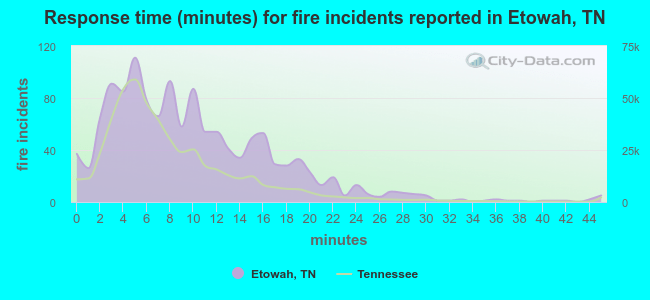 The median response time based on all reported fire incidents is 8 minutes. This is higher compared to the Tennessee median value.
The median response time in Etowah, TN compared to nearest cities:
(Note: Based on data for all years, including only cities with at least 500 fire incidents)
| Etowah: | 8 minutes |
| Englewood: | 8 minutes |
| Athens: | 6 minutes |
| Riceville: | 11 minutes |
| Calhoun: | 5 minutes |
| Niota: | 10 minutes |
| Tellico Plains: | 10 minutes |
| Madisonville: | 10 minutes |
| Sweetwater: | 11 minutes |
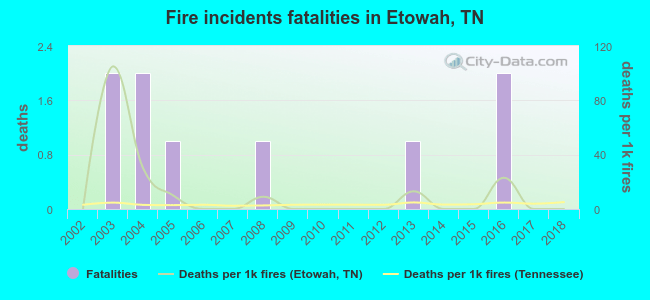 According to the data from the years 2002 - 2018 the average number of fire-related fatalities per year is 1. The highest number of reported deaths - 2 took place in 2003, and the lowest - 0 in 2002. The data has a constant trend.
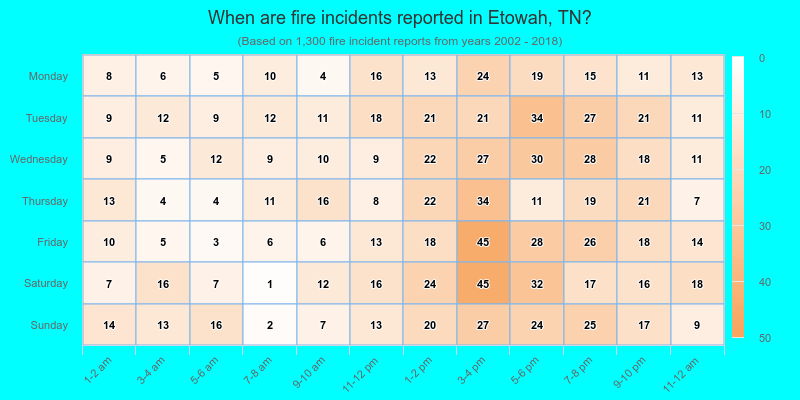
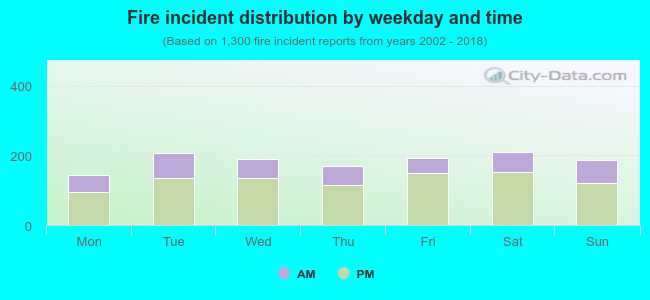 30.5% incidents where reported in the morning and 69.5% in the evening. The most fires (16.2%) took place on Saturday, and the least (11.1%) on Monday.
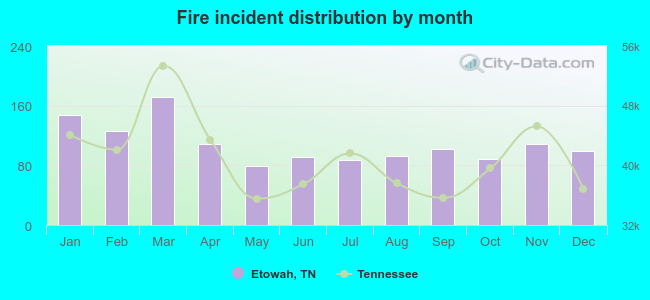 According to the 1,300 incident reports from years 2002 - 2018 most fires (13.2%) took place during March, and the least (6.1%) in May.
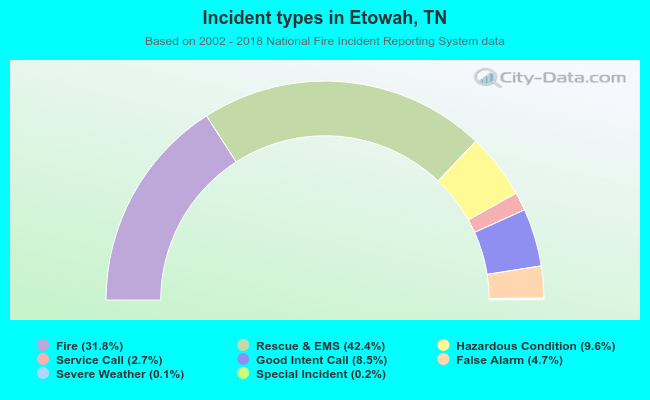 Out of all 4,087 cases reported during the years 2002 - 2018, the most belonged to the categories: Overpressure Rupture (42.4%), Fire (31.8%), and Rescue & EMS (9.6%).
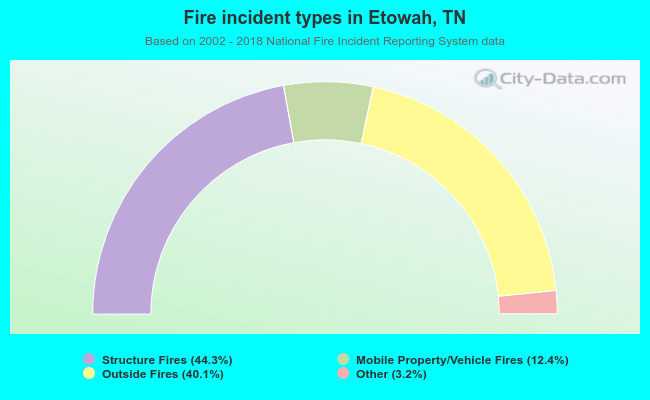 When looking into fire subcategories, the most reports belonged to: Structure Fires (44.3%), and Outside Fires (40.1%).