| Fire incidents reported |
|---|
| Sreet name | Count |
|---|
| HWY 59 NORTH | 14 | | 210TH AVE | 8 | | HWY 59 | 8 | | US HWY 59 | 8 | | 200TH AVE | 6 | | 210TH AVE SE | 6 | | SUNSET SHORES | 6 | | UNION DR | 6 | | 180TH AVE | 4 | | 1ST DR | 4 | | 21173 390TH ST SE | 4 | | 220TH AV SE | 4 | | 220TH AVE | 4 | | 233 RD AVE | 4 | | 23729 OAK LAKE SE | 4 | | 300TH ST | 4 | | 310 AVE | 4 | | 310TH ST | 4 | | 33257 210TH AVE SE | 4 | | 360TH ST | 4 | | ELM AVE | 4 | | HWT 59&2 | 4 | | HWY 2 | 4 | | MAPLE LAKE DITCH | 4 | | ROSS AVE | 4 |
| | | Fire incidents reported |
|---|
| Sreet name | Count |
|---|
| VANCE AVE | 4 | | VANCE AVE CAMERON LAKE | 4 | | 111 5TH STREET | 2 | | 127 VANCE AVE S | 2 | | 133 5TH ST SO | 2 | | 150TH AVE SE | 2 | | 170 TH 3 AVE | 2 | | 173 RD AVE SE | 2 | | 173RD AVE | 2 | | 18619 390TH SE | 2 | | 190TH AVE | 2 | | 190TH ST | 2 | | 19891 280TH ST SE | 2 | | 19922 370TH ST SE | 2 | | 2 MILES NORTH ON OLD 59 | 2 | | 2 MILES SOUTH ON HWY 59 | 2 | | 2 MILES WEST OF MAC 1/2S | 2 | | 203 N VANCE | 2 | | 20625 PINE RIDGE CIRCLE S | 2 | | 210 TH AVE | 2 | | 210TH ST | 2 | | 21687 380TH ST SE | 2 | | 22091 320 SE | 2 | | 222ND AVE | 2 | | |
|
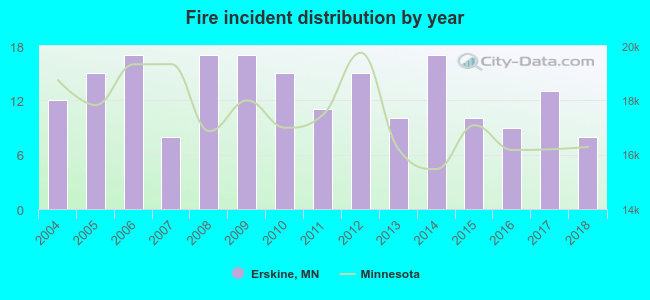 According to the data from the years 2004 - 2018 the average number of fire incidents per year is 13. The highest number of fire incidents - 17 took place in 2006, and the least - 8 in 2007. The data has a dropping trend.
 30.4% incidents where reported in the morning and 69.6% in the evening. The most fires (17.5%) took place on Sunday, and the least (10.3%) on Tuesday.
 Based on the 194 fires from years 2004 - 2018 most fires (30.4%) took place during April, and the least (1.5%) in February.
 Out of all 499 cases reported during the years 2004 - 2018, the most belonged to the categories: Overpressure Rupture (53.5%), Fire (38.9%), and Good Intent Call (3.0%).
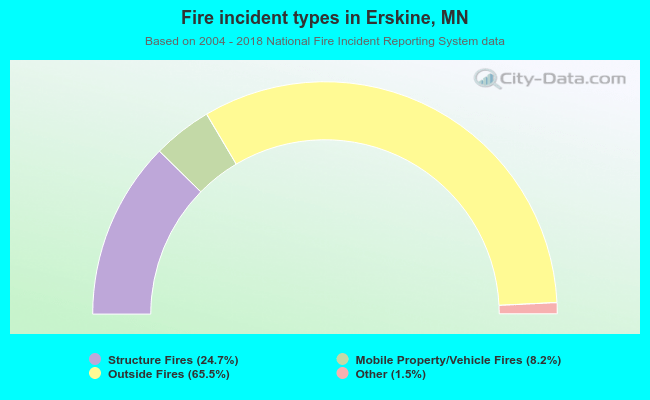 When looking into fire subcategories, the most incidents belonged to: Outside Fires (65.5%), and Structure Fires (24.7%).