Erie: Fire Incidents, Illinois (IL)
Where are fire incidents reported in Erie, IL
Something went wrong! Please refresh the page.
|
| |||||||||||||||||||||||||||||||||||||||||||||||||||||||||||||||||||||||||||||||||||||||||||||||||||||||||||||
| Other | 42 | |||||||||||||||||||||||||||||||||||||||||||||||||||||||||||||||||||||||||||||||||||||||||||||||||||||||||||||
2002 - 2018 National Fire Incident Reporting System (NFIRS) incidents
- Incident types reported to NFIRS in Erie, IL
- 40459.9%Fire
- 11917.6%Rescue & EMS
- 7511.1%Hazardous Condition
- 355.2%Good Intent Call
- 192.8%Service Call
- 152.2%False Alarm
- 40.6%Overpressure Rupture
- 40.6%Severe Weather
- Fire incident types reported to NFIRS in Erie, IL
- 23056.9%Outside Fires
- 10024.8%Structure Fires
- 4711.6%Mobile Property/Vehicle Fires
- 276.7%Other
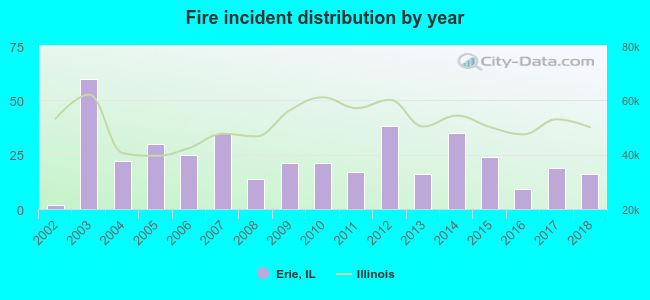 According to the data from the years 2002 - 2018 the average number of fires per year is 24. The highest number of fire incidents - 60 took place in 2003, and the least - 2 in 2002. The data has a growing trend.
 26.5% incidents where reported in the morning and 73.5% in the evening. The most fires (16.1%) took place on Sunday, and the least (12.4%) on Tuesday.
 Based on the 404 fire incident reports from years 2002 - 2018 most fires (21.3%) took place during March, and the least (4.0%) in September.
 Out of all 675 cases reported during the years 2002 - 2018, the most belonged to the categories: Fire (59.9%), Rescue & EMS (17.6%), and Hazardous Condition (11.1%).
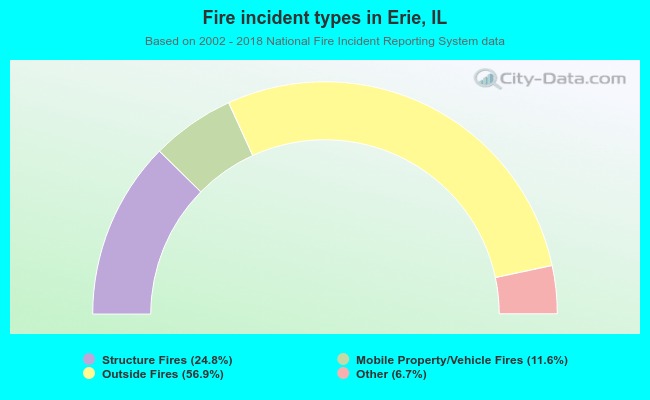 When looking into fire subcategories, the most reports belonged to: Outside Fires (56.9%), and Structure Fires (24.8%).