Eolia: Fire Incidents, Missouri (MO)
Where are fire incidents reported in Eolia, MO
Something went wrong! Please refresh the page.
|
| |||||||||||||||||||||||||||||||||||||||||||||||||||||||||||||||||||||||||||||||||||||||||||||||||||||||||||||
2002 - 2017 National Fire Incident Reporting System (NFIRS) incidents
- Incident types reported to NFIRS in Eolia, MO
- 28140.0%Fire
- 19527.7%Hazardous Condition
- 16022.8%Rescue & EMS
- 476.7%Good Intent Call
- 91.3%False Alarm
- 81.1%Service Call
- 20.3%Special Incident
- 10.1%Severe Weather
- Fire incident types reported to NFIRS in Eolia, MO
- 12343.8%Outside Fires
- 9433.5%Structure Fires
- 3813.5%Mobile Property/Vehicle Fires
- 269.3%Other
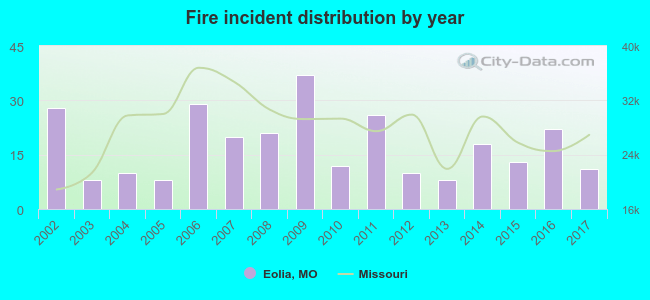 According to the data from the years 2002 - 2017 the average number of fires per year is 18. The highest number of reported fires - 37 took place in 2009, and the least - 8 in 2003. The data has a declining trend.
 Based on the reports from the years 2002 - 2017 the average number of fire-related yearly casualties is 0. The highest number of casualties - 1 took place in 2003, and the lowest - 0 in 2002. The data has a constant trend.
 26.0% incidents where reported in the morning and 74.0% in the evening. The most fires (16.7%) took place on Friday, and the least (12.1%) on Monday.
 Based on the 281 fire incident reports from years 2002 - 2017 most fires (19.9%) took place during March, and the least (3.9%) in May.
 Out of all 703 cases reported during the years 2002 - 2017, the most belonged to the categories: Fire (40.0%), Rescue & EMS (27.7%), and Overpressure Rupture (22.8%).
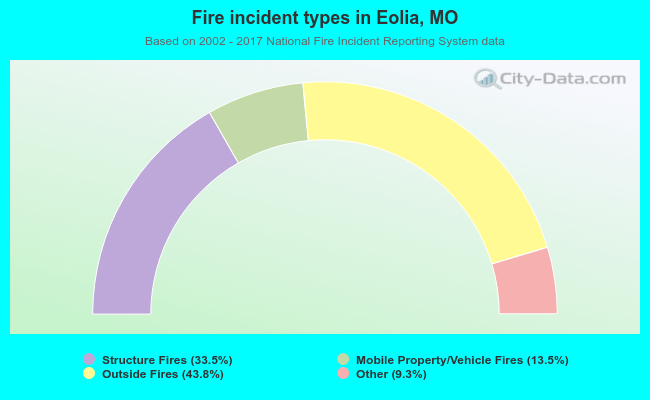 When looking into fire subcategories, the most incidents belonged to: Outside Fires (43.8%), and Structure Fires (33.5%).