| Fire incidents reported |
|---|
| Sreet name | Count |
|---|
| MATTHEWS RD | 12 | | CURTIS RD | 10 | | HWY 107 | 10 | | CAUDILL RD | 8 | | HWY 310 HWY | 8 | | HEFFINGTON CEMETERY RD | 6 | | HWY 107 HWY | 6 | | MARCUS HILL RD | 6 | | MARCUS HILL ROAD | 6 | | 30 WHITE OAK RD | 4 | | 310 GARLAND SPRINGS ROAD | 4 | | 340 NIX RD | 4 | | 4 MARCUS HILL RD | 4 | | 419 HWY 36 | 4 | | 518 HWY 36 | 4 | | CANDILL RD | 4 | | CARDIN CIR | 4 | | GARREN LANE | 4 | | HWY 310 | 4 | | HWY 36 | 4 | | JOHN T RD | 4 | | MARCUS HILL | 4 | | MARCUS HILL RD | 4 | | MT NEBO RD | 4 | | MT NEBO RD | 4 |
| | | Fire incidents reported |
|---|
| Sreet name | Count |
|---|
| WHITE OAK RD | 4 | | WILSON BOTTOMS RD | 4 | | 1 HODGE ROAD | 2 | | 1 JIM HACKLER LANE | 2 | | 10 BLUFF COVE LGTS | 2 | | 10 BLUFFCOVE | 2 | | 10 GARREN LANE | 2 | | 105 GARLAND SPRINGS | 2 | | 107 GOODLOOE RD | 2 | | 122 BARNEY RD | 2 | | 122 BARNEY RD LGTS | 2 | | 123 HEFFINGTON CEMENTARY RD | 2 | | 123 MARCUS HILL RD | 2 | | 1255 HWY | 2 | | 14 HWY 310 LGTS | 2 | | 15 CURTIS CIRCLE | 2 | | 150 SAWMILL RD | 2 | | 151 SAW MILL RD | 2 | | 151 WHITE OAK RD | 2 | | 16 CAUDILL RD | 2 | | 16 HOLLAND HILL LOOP | 2 | | 17 BRANCH RD | 2 | | 17 GARREN LN | 2 | | 173 HWY 310 | 2 | | |
|
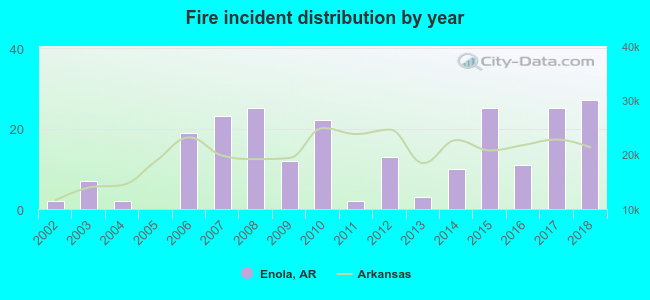 Based on the data from the years 2002 - 2018 the average number of fire incidents per year is 13. The highest number of fires - 27 took place in 2018, and the least - 0 in 2005. The data has a rising trend.
 16.2% incidents where reported in the morning and 83.8% in the evening. The most fires (19.7%) took place on Saturday, and the least (11.4%) on Tuesday.
 According to the 228 reports from years 2002 - 2018 most fires (18.0%) took place during March, and the least (3.1%) in May.
 Out of all 421 cases reported during the years 2002 - 2018, the most belonged to the categories: Fire (54.2%), Overpressure Rupture (32.8%), and Service Call (5.5%).
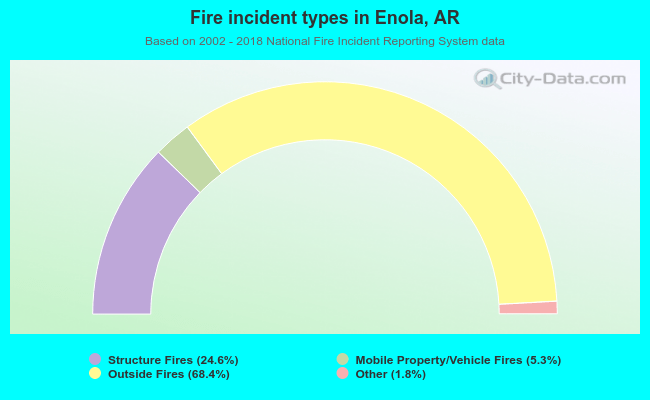 When looking into fire subcategories, the most incidents belonged to: Outside Fires (68.4%), and Structure Fires (24.6%).