Empire: Fire Incidents, Ohio (OH)
Where are fire incidents reported in Empire, OH
Something went wrong! Please refresh the page.
|
| |||||||||||||||||||||||||||||||||||||||||||||||||||||||||||||||||||||||||||||||||||||||||
2002 - 2018 National Fire Incident Reporting System (NFIRS) incidents
- Incident types reported to NFIRS in Empire, OH
- 18741.8%Fire
- 15935.6%Rescue & EMS
- 4710.5%Service Call
- 337.4%Hazardous Condition
- 122.7%Good Intent Call
- 30.7%False Alarm
- 30.7%Severe Weather
- 20.4%Special Incident
- 10.2%Overpressure Rupture
- Fire incident types reported to NFIRS in Empire, OH
- 9651.3%Structure Fires
- 6333.7%Outside Fires
- 2714.4%Mobile Property/Vehicle Fires
- 10.5%Other
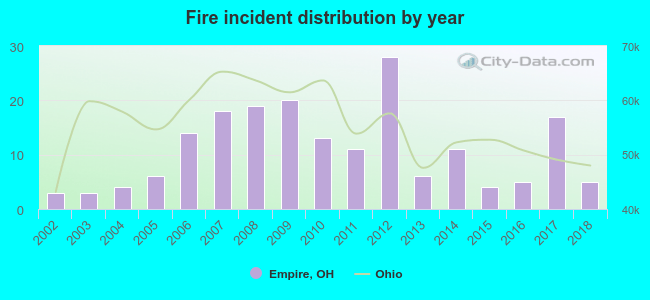 According to the data from the years 2002 - 2018 the average number of fire incidents per year is 11. The highest number of fire incidents - 28 took place in 2012, and the least - 3 in 2002. The data has a growing trend.
 23.5% incidents where reported in the morning and 76.5% in the evening. The most fires (24.6%) took place on Saturday, and the least (8.0%) on Monday.
 Based on the 187 incident reports from years 2002 - 2018 most fires (13.9%) took place during April, and the least (3.2%) in July.
 Out of all 447 cases reported during the years 2002 - 2018, the most belonged to the categories: Fire (41.8%), Rescue & EMS (35.6%), and Service Call (10.5%).
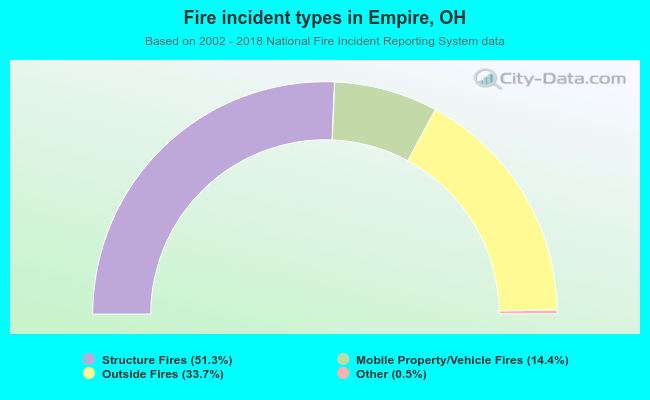 When looking into fire subcategories, the most incidents belonged to: Structure Fires (51.3%), and Outside Fires (33.7%).