| Fire incidents reported |
|---|
| Sreet name | Count |
|---|
| SNYDERTOWN ROAD SR 4012 | 10 | | SR 54 | 10 | | CENTER ST | 8 | | MIDDLE ROAD | 6 | | SR 61 | 6 | | CENTER ST. | 4 | | HILLSIDE AVE. | 4 | | RT 54 | 4 | | SR 487 | 4 | | 1 MEMORIAL PARK AVE | 2 | | 116 POCOHANTAS LANE | 2 | | 19 BIRCHWYN DRIVE | 2 | | 260 ORCHARD DRIVE | 2 | | 277 W. CENTER ST. | 2 | | 382 BERKS ROAD | 2 | | 7 PARKVIEW ROAD | 2 | | 775 WEST CENTER | 2 | | ADAMS AVE | 2 | | ADAMS AVE | 2 | | AIRPORT RD | 2 | | AIRPORT RD. | 2 | | BEAR GAP RD | 2 | | BEAR GAP RD. | 2 | | BEAR GAP ROAD | 2 | | BILLMAN RD | 2 |
| | | Fire incidents reported |
|---|
| Sreet name | Count |
|---|
| BOTTLE RD | 2 | | BUTTERNUT | 2 | | BUTTERNUT LANE | 2 | | BUTTERNUT LN | 2 | | CARMELITE MONASTREY | 2 | | CATMAN HOLLOW RD. | 2 | | CENTER SCHOOL ROAD | 2 | | CENTER STREET | 2 | | CLARK ROAD | 2 | | DOGWOOD RD. | 2 | | DOLLAR GENERAL STORE | 2 | | DRUMHELLER RD | 2 | | ELM RD. | 2 | | HILLCREST & SPRUCE | 2 | | HILLSIDE AVE | 2 | | HILLSIDE DRIVE | 2 | | HORIZON | 2 | | HORIZON DRIVE | 2 | | JACKSON RD | 2 | | JEREMIAH | 2 | | JEREMIAH ROAD | 2 | | LAWRENCE AVE | 2 | | LINDY ACRES RD. | 2 | | M&T BANK | 2 | | |
|
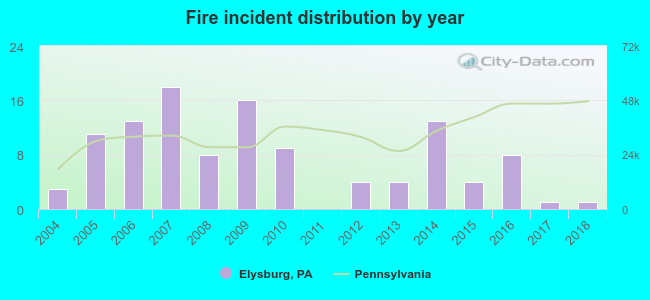 According to the data from the years 2004 - 2018 the average number of fire incidents per year is 8. The highest number of fires - 18 took place in 2007, and the least - 0 in 2011. The data has a declining trend.
 34.5% incidents where reported in the morning and 65.5% in the evening. The most fires (16.8%) took place on Wednesday, and the least (8.0%) on Monday.
 Based on the 113 reports from years 2004 - 2018 most fires (14.2%) took place during April, and the least (3.5%) in September.
 Out of all 440 cases reported during the years 2004 - 2018, the most belonged to the categories: Rescue & EMS (51.4%), Fire (25.7%), and Overpressure Rupture (8.6%).
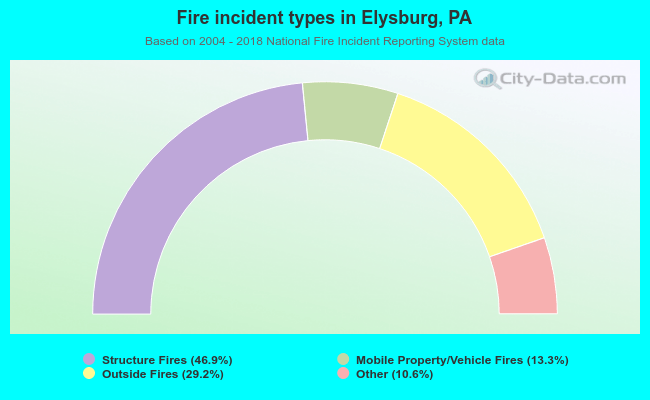 When looking into fire subcategories, the most reports belonged to: Structure Fires (46.9%), and Outside Fires (29.2%).