Elroy: Fire Incidents, Wisconsin (WI)
Where are fire incidents reported in Elroy, WI
Something went wrong! Please refresh the page.
|
| |||||||||||||||||||||||||||||||||||||||||||||||||||||||||||||||||||||||||||||||||||||||||||||||||||||||||||||
2004 - 2018 National Fire Incident Reporting System (NFIRS) incidents
- Incident types reported to NFIRS in Elroy, WI
- 16458.8%Fire
- 5519.7%Rescue & EMS
- 2910.4%Hazardous Condition
- 124.3%Good Intent Call
- 103.6%False Alarm
- 62.2%Service Call
- 20.7%Special Incident
- 10.4%Overpressure Rupture
- Fire incident types reported to NFIRS in Elroy, WI
- 9759.1%Structure Fires
- 4728.7%Outside Fires
- 127.3%Mobile Property/Vehicle Fires
- 84.9%Other
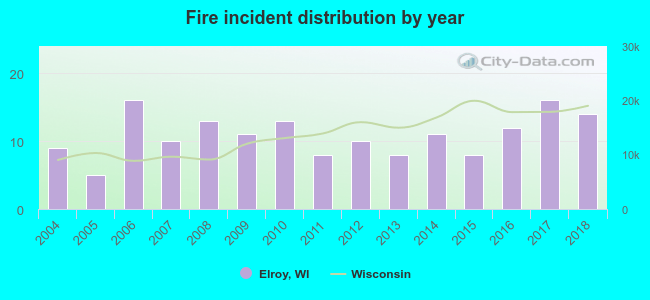 Based on the data from the years 2004 - 2018 the average number of fires per year is 11. The highest number of fires - 16 took place in 2006, and the least - 5 in 2005. The data has a growing trend.
 Based on the data from the years 2004 - 2018 the average number of fire-related yearly casualties is 0. The highest number of injuries - 3 took place in 2004, and the lowest - 0 in 2005. The data has a declining trend.
 32.3% incidents where reported in the morning and 67.7% in the evening. The most fires (17.7%) took place on Sunday, and the least (10.4%) on Saturday.
 Based on the 164 fire incident reports from years 2004 - 2018 most fires (17.1%) took place during April, and the least (2.4%) in September.
 Out of all 279 cases reported during the years 2004 - 2018, the most belonged to the categories: Fire (58.8%), Rescue & EMS (19.7%), and Hazardous Condition (10.4%).
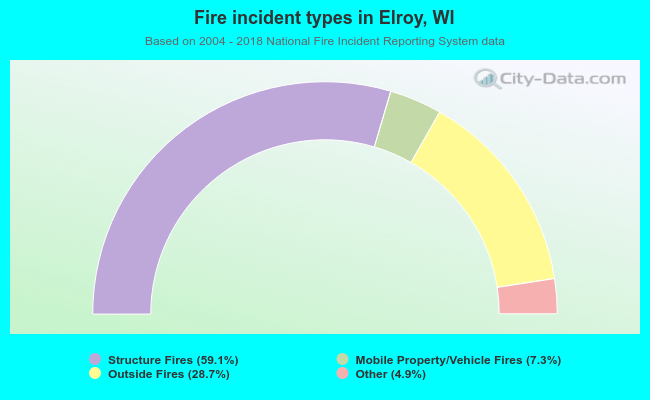 When looking into fire subcategories, the most reports belonged to: Structure Fires (59.1%), and Outside Fires (28.7%).