Elmwood Place: Fire Incidents, Ohio (OH)
Where are fire incidents reported in Elmwood Place, OH
Something went wrong! Please refresh the page.
|
| |||||||||||||||||||||||||||||||||||||||||||||||||||||||||||||||||||||||||||||||||||||||||||||||||||||||||||||
2002 - 2018 National Fire Incident Reporting System (NFIRS) incidents
- Incident types reported to NFIRS in Elmwood Place, OH
- 43234.0%Fire
- 33726.5%Hazardous Condition
- 19115.0%Rescue & EMS
- 13110.3%Service Call
- 846.6%False Alarm
- 675.3%Good Intent Call
- 161.3%Severe Weather
- 100.8%Special Incident
- 20.2%Overpressure Rupture
- Fire incident types reported to NFIRS in Elmwood Place, OH
- 29568.3%Structure Fires
- 9020.8%Outside Fires
- 409.3%Mobile Property/Vehicle Fires
- 71.6%Other
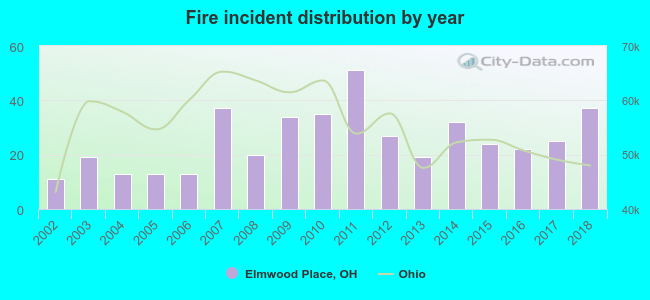 According to the data from the years 2002 - 2018 the average number of fire incidents per year is 25. The highest number of fire incidents - 51 took place in 2011, and the least - 11 in 2002. The data has a growing trend.
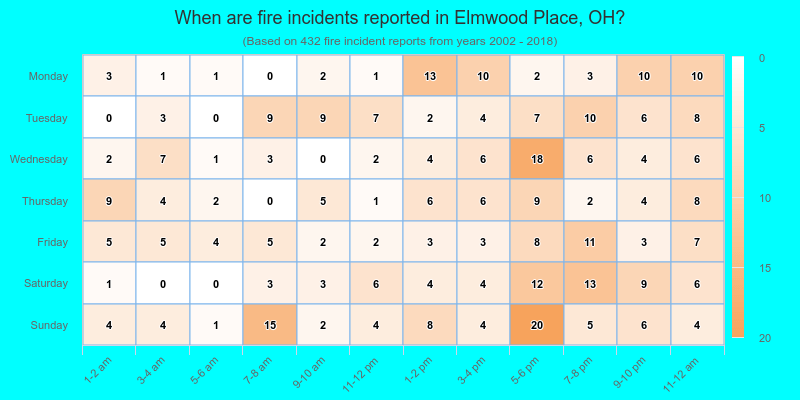
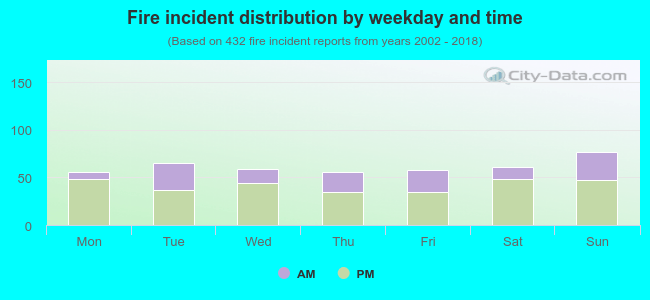 31.9% incidents where reported in the morning and 68.1% in the evening. The most fires (17.8%) took place on Sunday, and the least (13.0%) on Monday.
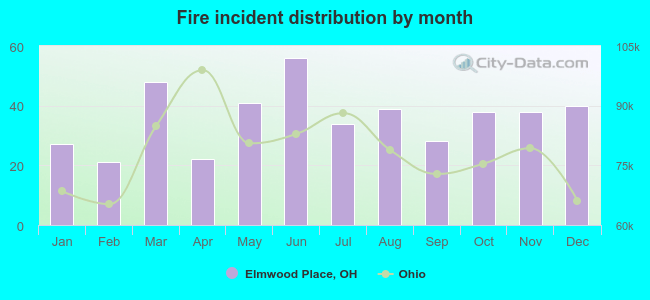 Based on the 432 incident reports from years 2002 - 2018 most fires (13.0%) took place during June, and the least (4.9%) in February.
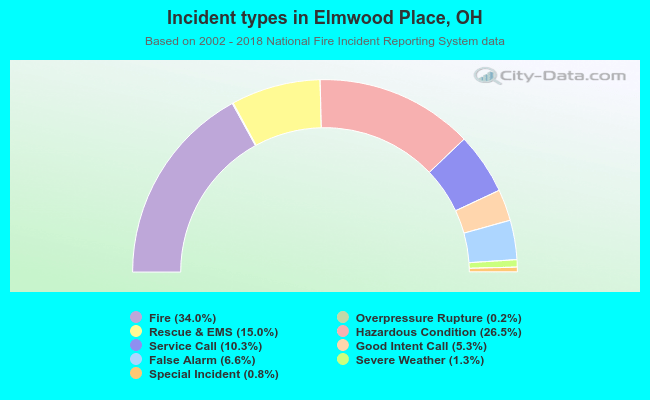 Out of all 1,270 cases reported during the years 2002 - 2018, the most belonged to the categories: Fire (34.0%), Hazardous Condition (26.5%), and Rescue & EMS (15.0%).
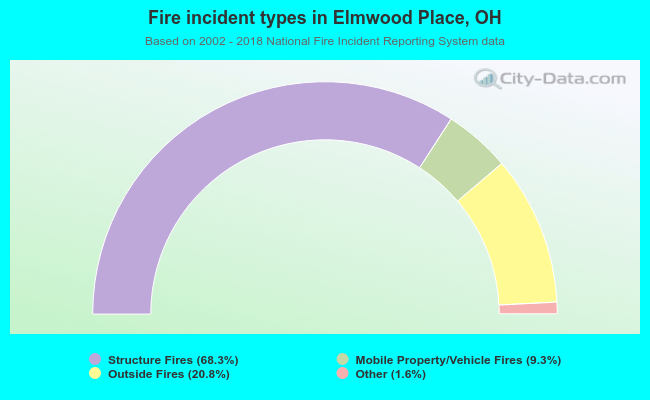 When looking into fire subcategories, the most incidents belonged to: Structure Fires (68.3%), and Outside Fires (20.8%).