Ellenton: Fire Incidents, Florida (FL)
Where are fire incidents reported in Ellenton, FL
Something went wrong! Please refresh the page.
|
| |||||||||||||||||||||||||||||||||||||||||||||||||||||||||||||||||||||||||||||||||||||||||||||||||||||||||||||
| Other | 73 | |||||||||||||||||||||||||||||||||||||||||||||||||||||||||||||||||||||||||||||||||||||||||||||||||||||||||||||
2003 - 2018 National Fire Incident Reporting System (NFIRS) incidents
- Incident types reported to NFIRS in Ellenton, FL
- 2,64762.7%Rescue & EMS
- 3799.0%Fire
- 3568.4%Hazardous Condition
- 3408.1%Good Intent Call
- 2766.5%False Alarm
- 2165.1%Service Call
- 50.1%Overpressure Rupture
- Fire incident types reported to NFIRS in Ellenton, FL
- 13435.4%Outside Fires
- 11931.4%Mobile Property/Vehicle Fires
- 11430.1%Structure Fires
- 123.2%Other
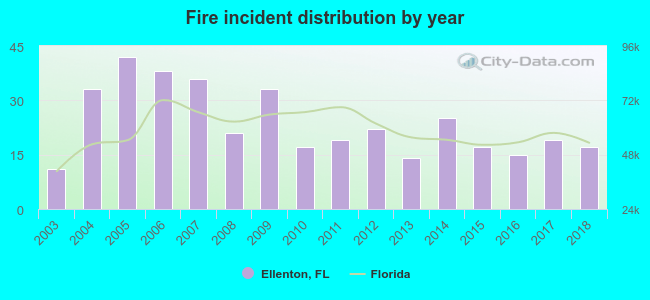 According to the data from the years 2003 - 2018 the average number of fire incidents per year is 24. The highest number of fire incidents - 42 took place in 2005, and the least - 11 in 2003. The data has a growing trend.
 30.9% incidents where reported in the morning and 69.1% in the evening. The most fires (17.4%) took place on Saturday, and the least (10.3%) on Thursday.
 According to the 379 fire incident reports from years 2003 - 2018 most fires (10.0%) took place during March, and the least (6.3%) in September.
 Out of all 4,221 cases reported during the years 2003 - 2018, the most belonged to the categories: Rescue & EMS (62.7%), Fire (9.0%), and Hazardous Condition (8.4%).
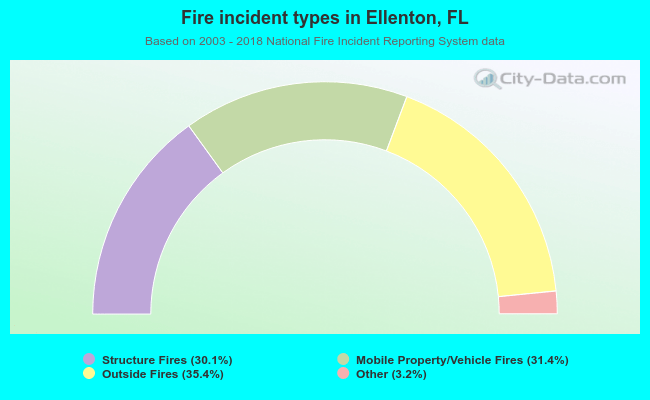 When looking into fire subcategories, the most reports belonged to: Outside Fires (35.4%), and Mobile Property/Vehicle Fires (31.4%).