| Fire incidents reported |
|---|
| Sreet name | Count |
|---|
| I-39 | 28 | | 850 EAST 2ND | 20 | | CR 800 N | 8 | | CR 2800E | 6 | | 100 EAST CLAY | 4 | | 2375 | 4 | | 999 NORTH GRANT | 4 | | CR 2600 E | 4 | | CR 600 N | 4 | | CR 900 N | 4 | | EL PASO | 4 | | FIFTH ST | 4 | | HIBBS | 4 | | SECOND ST | 4 | | US 24 HWY | 4 | | US 251 HWY | 4 | | 1 ST STREET | 2 | | 100 E | 2 | | 107 WEST 3RD | 2 | | 110 NORTH ADAMS | 2 | | 1100 NORTH 2800 EAST | 2 | | 1209 2525 EAST | 2 | | 1220 CR 2525 EAST | 2 | | 1257N 2600 EAST RD | 2 | | 137 MAIN STREET | 2 |
| | | Fire incidents reported |
|---|
| Sreet name | Count |
|---|
| 1378 N 2600 E | 2 | | 1436 2600 EAST | 2 | | 150 SOUTH COMMERCAL | 2 | | 1500 RD EAST | 2 | | 1600 N | 2 | | 180 EAST 1ST | 2 | | 1800 N 3027 E | 2 | | 20 EAST 3RD | 2 | | 200 EAST JEFFERSON | 2 | | 202 W JEFFERSON | 2 | | 203 EAST 3RD | 2 | | 21 EAST FRONT | 2 | | 2101 EAST MAIN | 2 | | 220 EAST JEFFERSON | 2 | | 2200 NORTH 2900 EAST | 2 | | 2450 N MCLEAN CO | 2 | | 247 SYCAMORE ST | 2 | | 249 FRONT ST | 2 | | 25 LINCO DRIVE | 2 | | 250 E | 2 | | 250 EAST 2ND | 2 | | 2525 1100 NORTH | 2 | | 2580 TAMARAC | 2 | | 2600 E | 2 | | |
|
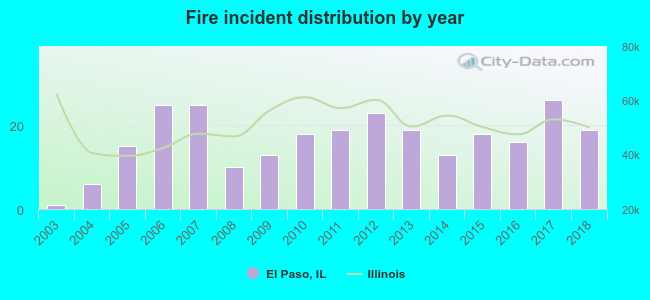 According to the data from the years 2003 - 2018 the average number of fire incidents per year is 17. The highest number of fires - 26 took place in 2017, and the least - 1 in 2003. The data has a rising trend.
 24.8% incidents where reported in the morning and 75.2% in the evening. The most fires (17.7%) took place on Saturday, and the least (10.9%) on Sunday.
 Based on the 266 reports from years 2003 - 2018 most fires (12.0%) took place during July, and the least (2.3%) in December.
 Out of all 502 cases reported during the years 2003 - 2018, the most belonged to the categories: Fire (53.0%), Overpressure Rupture (19.7%), and Rescue & EMS (14.1%).
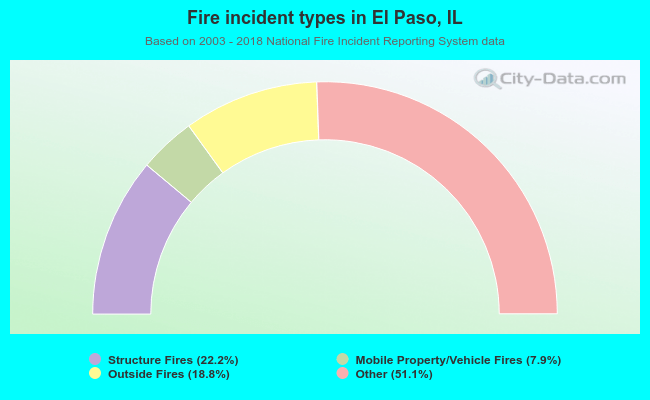 When looking into fire subcategories, the most reports belonged to: Other (51.1%), and Structure Fires (22.2%).