| Fire incidents reported |
|---|
| Sreet name | Count |
|---|
| TIMOTHY DR | 8 | | EASTBROOK DR | 6 | | WEST BROOK ROAD | 6 | | 115 | 4 | | 3213 WOODCREST AVE | 4 | | 830 WEST BROOK RD | 4 | | BAYBERRY RD | 4 | | CHIPPERFIELD DR | 4 | | JOHNS RD | 4 | | MERWINSBURG RD | 4 | | RED PINE LN | 4 | | RT 115 | 4 | | STATE RD | 4 | | 10 MOSSY LANE | 2 | | 108 FREEMONT DR | 2 | | 109 LAWARENCE DR | 2 | | 1101 BAYBERRY RD | 2 | | 1107 BAYBERRY RD | 2 | | 111 SCOTT ST | 2 | | 1112 BAYBERRY RD | 2 | | 1114 PARISH PARK | 2 | | 117 MEADOWLARK LANE | 2 | | 117 RENA DR | 2 | | 119 SQUIRRELWOOD CT | 2 | | 125 MEMORY LANE | 2 |
| | | Fire incidents reported |
|---|
| Sreet name | Count |
|---|
| 1405 DAVID LANE | 2 | | 142 FREEMONT DR | 2 | | 147 WINTER HILL RD | 2 | | 1580 STARRY LANE | 2 | | 1644 RED PINE LANE | 2 | | 1710 SILVER MAPLE RD | 2 | | 1904 DONALDS RD | 2 | | 202 DRESSAGE DR | 2 | | 202 ROCKY MOUNTAIN DR N | 2 | | 217 STARLIGHT DR | 2 | | 220 ORCHARD VIEW DR | 2 | | 224 NEW YORK BLVD | 2 | | 2254 SUNSET LANE | 2 | | 2302 HILL RD | 2 | | 248 MERWINSBURG RD | 2 | | 2512 ROUTE 115 | 2 | | 2553 BIRCH HOLLOW DR | 2 | | 296 LONG WOODS RD | 2 | | 301 JAMES RD | 2 | | 3078 STATE ROUTE 115 | 2 | | 3118 WOOD CREST AVE | 2 | | 3532 HIGH HIL RD | 2 | | 404 BARRYS RD | 2 | | 406 EASTBROOK RD | 2 | | |
|
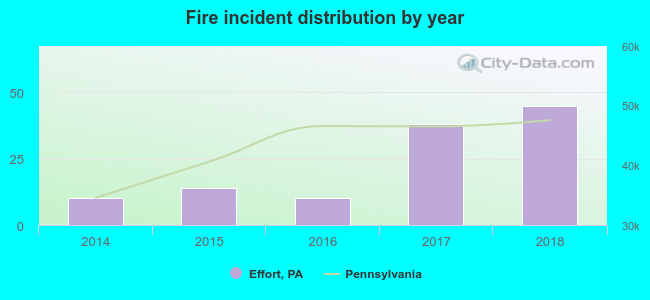 According to the data from the years 2014 - 2018 the average number of fire incidents per year is 23. The highest number of fires - 45 took place in 2018, and the least - 10 in 2014. The data has a rising trend.
 35.0% incidents where reported in the morning and 65.0% in the evening. The most fires (23.1%) took place on Thursday, and the least (9.4%) on Wednesday.
 Based on the 117 reports from years 2014 - 2018 most fires (17.1%) took place during April, and the least (1.7%) in June.
 Out of all 380 cases reported during the years 2014 - 2018, the most belonged to the categories: Fire (30.8%), Rescue & EMS (20.3%), and Good Intent Call (17.9%).
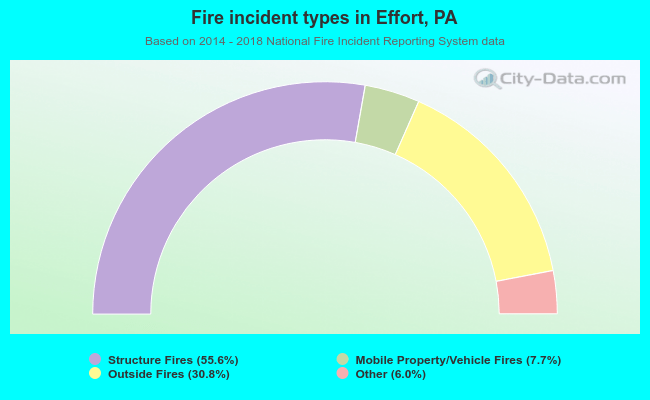 When looking into fire subcategories, the most reports belonged to: Structure Fires (55.6%), and Outside Fires (30.8%).