Eau Claire: Fire Incidents, Michigan (MI)
Where are fire incidents reported in Eau Claire, MI
Something went wrong! Please refresh the page.
|
| |||||||||||||||||||||||||||||||||||||||||||||||||||||||||||||||||||||||||||||||||||||||||||||||||||||||||||||
2002 - 2018 National Fire Incident Reporting System (NFIRS) incidents
- Incident types reported to NFIRS in Eau Claire, MI
- 34545.6%Fire
- 24632.5%Rescue & EMS
- 10614.0%Hazardous Condition
- 263.4%Service Call
- 202.6%Good Intent Call
- 111.5%False Alarm
- 20.3%Overpressure Rupture
- Fire incident types reported to NFIRS in Eau Claire, MI
- 18453.3%Structure Fires
- 12135.1%Outside Fires
- 3710.7%Mobile Property/Vehicle Fires
- 30.9%Other
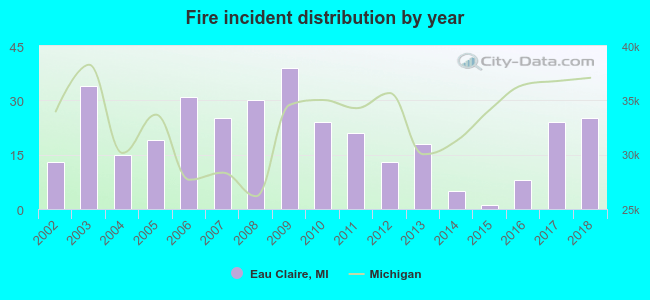 Based on the data from the years 2002 - 2018 the average number of fire incidents per year is 20. The highest number of fire incidents - 39 took place in 2009, and the least - 1 in 2015. The data has an increasing trend.
 Based on the data from the years 2002 - 2018 the average number of fire-related yearly casualties is 0. The highest number of reported injuries - 3 took place in 2009, and the lowest - 0 in 2002. The data has a growing trend.
 29.6% incidents where reported in the morning and 70.4% in the evening. The most fires (18.6%) took place on Saturday, and the least (11.3%) on Friday.
 Based on the 345 reports from years 2002 - 2018 most fires (14.5%) took place during April, and the least (4.3%) in September.
 Out of all 756 cases reported during the years 2002 - 2018, the most belonged to the categories: Fire (45.6%), Rescue & EMS (32.5%), and Hazardous Condition (14.0%).
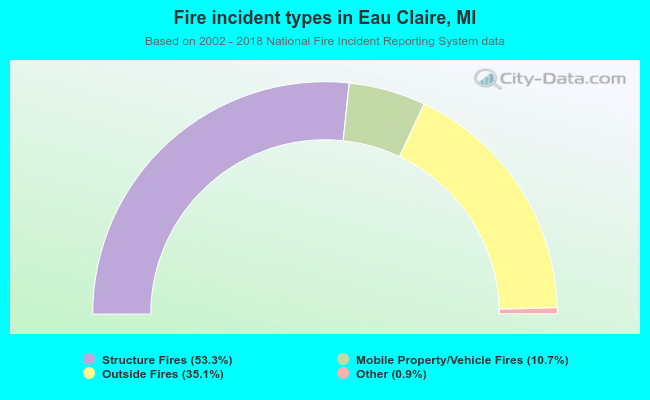 When looking into fire subcategories, the most reports belonged to: Structure Fires (53.3%), and Outside Fires (35.1%).