Eaton: Fire Incidents, New York (NY)
Where are fire incidents reported in Eaton, NY
Something went wrong! Please refresh the page.
|
| |||||||||||||||||||||||||||||||||||||||||||||||||||||||||||||||||||||||||||||||||||||||||||||||||||||||||||||
2003 - 2018 National Fire Incident Reporting System (NFIRS) incidents
- Incident types reported to NFIRS in Eaton, NY
- 44557.9%Rescue & EMS
- 13517.6%Fire
- 9111.8%Good Intent Call
- 607.8%Hazardous Condition
- 233.0%Service Call
- 70.9%False Alarm
- 50.7%Special Incident
- 20.3%Severe Weather
- Fire incident types reported to NFIRS in Eaton, NY
- 10880.0%Structure Fires
- 1511.1%Outside Fires
- 85.9%Mobile Property/Vehicle Fires
- 43.0%Other
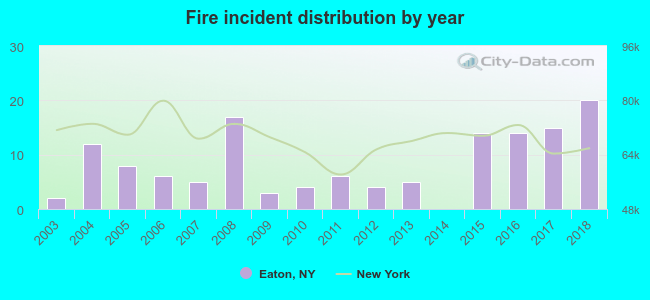 According to the data from the years 2003 - 2018 the average number of fires per year is 8. The highest number of fires - 20 took place in 2018, and the least - 0 in 2014. The data has an increasing trend.
The average number of yearly fire incidents per 10k residents in Eaton, NY compared to nearest cities:
(Note: Based on data for the last 3 years, including only cities with population 5,000 and above)
| Eaton: | 31.1 |
| Oneida: | 37.2 |
| Chittenango: | 48.5 |
| Pompey: | 8.9 |
| Verona: | 48.7 |
| Westmoreland: | 23.4 |
| Whitestown: | 1.1 |
| Norwich: | 92.3 |
| Rome: | 9.5 |

 40.7% incidents where reported in the morning and 59.3% in the evening. The most fires (17.0%) took place on Thursday, and the least (9.6%) on Friday.
 According to the 135 fire incidents from years 2003 - 2018 most fires (16.3%) took place during March, and the least (2.2%) in October.
 Out of all 768 cases reported during the years 2003 - 2018, the most belonged to the categories: Overpressure Rupture (57.9%), Fire (17.6%), and Service Call (11.8%).
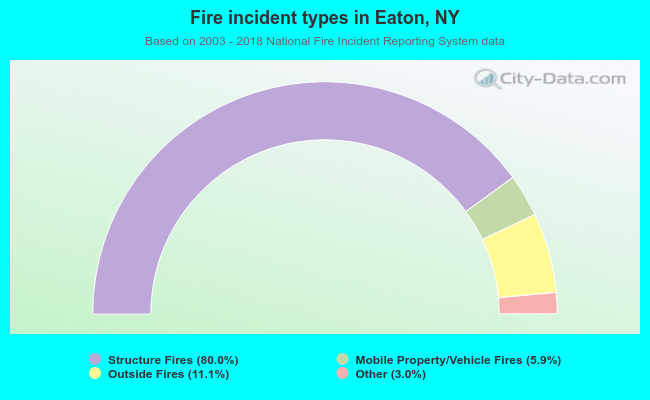 When looking into fire subcategories, the most reports belonged to: Structure Fires (80.0%), and Outside Fires (11.1%).