East Tawas: Fire Incidents, Michigan (MI)
Where are fire incidents reported in East Tawas, MI
Something went wrong! Please refresh the page.
|
| |||||||||||||||||||||||||||||||||||||||||||||||||||||||||||||||||||||||||||||||||||||||||||||||||||||||||||||
2002 - 2018 National Fire Incident Reporting System (NFIRS) incidents
- Incident types reported to NFIRS in East Tawas, MI
- 44133.4%Hazardous Condition
- 41531.4%Rescue & EMS
- 31223.6%Fire
- 866.5%Good Intent Call
- 453.4%False Alarm
- 131.0%Service Call
- 80.6%Overpressure Rupture
- Fire incident types reported to NFIRS in East Tawas, MI
- 19361.9%Structure Fires
- 8126.0%Outside Fires
- 299.3%Mobile Property/Vehicle Fires
- 92.9%Other
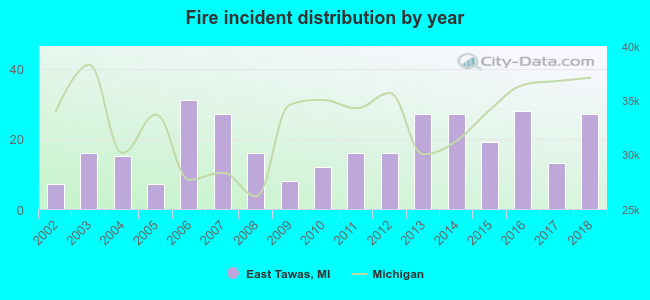 Based on the data from the years 2002 - 2018 the average number of fires per year is 18. The highest number of reported fire incidents - 31 took place in 2006, and the least - 7 in 2002. The data has an increasing trend.
 Based on the data from the years 2002 - 2018 the average number of fire-related casualties per year is 1. The highest number of casualties - 3 took place in 2015, and the lowest - 0 in 2002. The data has a constant trend.
 33.0% incidents where reported in the morning and 67.0% in the evening. The most fires (20.2%) took place on Sunday, and the least (11.9%) on Monday.
 According to the 312 reports from years 2002 - 2018 most fires (12.2%) took place during May, and the least (1.9%) in November.
 Out of all 1,321 cases reported during the years 2002 - 2018, the most belonged to the categories: Hazardous Condition (33.4%), Rescue & EMS (31.4%), and Fire (23.6%).
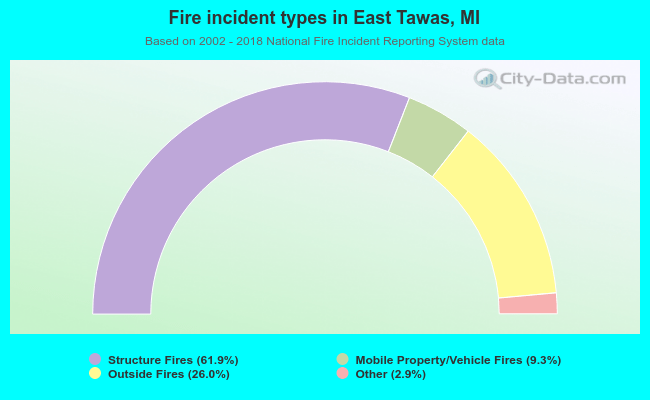 When looking into fire subcategories, the most incidents belonged to: Structure Fires (61.9%), and Outside Fires (26.0%).