| Fire incidents reported |
|---|
| Sreet name | Count |
|---|
| CLEVELAND AVE | 32 | | DOWNING ST | 32 | | DUEBER AVE | 32 | | HOWENSTINE DR | 28 | | RIDGE AVE | 28 | | GRACEMONT ST | 26 | | MAPLEHURST AVE | 22 | | SANDYVILLE RD | 22 | | BRIGGLE AVE | 20 | | SEEMAN ST | 20 | | FARBER ST | 18 | | E SPARTA AVE | 16 | | SANDY AVE | 12 | | ULLET ST | 12 | | BATTLESBURG ST | 10 | | HAUT ST | 10 | | VALLEY DR | 10 | | WALNUT ST | 10 | | BREEZEHILL RD | 8 | | EAST SPARTA AVE | 8 | | MAIN ST | 8 | | RIDGE RD | 8 | | CHESTNUT ST | 6 | | PLEASANT LAKE DR | 6 | | SHERMAN CH RD | 6 |
| | | Fire incidents reported |
|---|
| Sreet name | Count |
|---|
| 7373 SHERMAN CH. AVE | 4 | | DEERWOOD CIRCLE | 4 | | DEREK CIR | 4 | | FARBER RD | 4 | | FRISCO ST | 4 | | GRACEMONT | 4 | | GRACEMONT AVE | 4 | | GRACEMOUNT | 4 | | MAPLEHURST | 4 | | MELCHEIMER ST | 4 | | SHERMAN CHURCH AVE | 4 | | SHERMAN CHURCH RD | 4 | | SHERMAN CHURCH ST | 4 | | STINEWOOD AVE | 4 | | 10465 SANDYVILLE RD | 2 | | 11537 OAK ST | 2 | | 2286 DOWNING ST | 2 | | 2526 DOWNING AVE | 2 | | 2751 SEEMAN | 2 | | 2905 HOWENSTINE DRIVE S.E | 2 | | 3500 STEINWOOD S.E. | 2 | | 3619 GRACEMONT AVE | 2 | | 3619 GRACEMONT SW | 2 | | 4000 GRACEMONT ST | 2 | | |
|
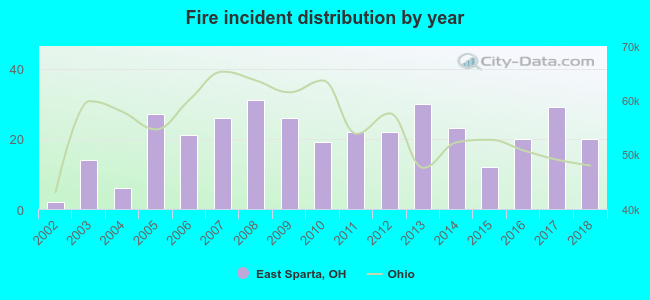 According to the data from the years 2002 - 2018 the average number of fires per year is 21. The highest number of fires - 31 took place in 2008, and the least - 2 in 2002. The data has a growing trend.
 36.0% incidents where reported in the morning and 64.0% in the evening. The most fires (17.4%) took place on Saturday, and the least (9.1%) on Monday.
 Based on the 350 fires from years 2002 - 2018 most fires (11.7%) took place during April, and the least (6.0%) in December.
 Out of all 1,089 cases reported during the years 2002 - 2018, the most belonged to the categories: Rescue & EMS (40.0%), Fire (32.1%), and Hazardous Condition (15.6%).
 When looking into fire subcategories, the most reports belonged to: Structure Fires (51.1%), and Outside Fires (29.1%).