East Pittsburgh: Fire Incidents, Pennsylvania (PA)
Where are fire incidents reported in East Pittsburgh, PA
Something went wrong! Please refresh the page.
|
| |||||||||||||||||||||||||||||||||||||||||||||||||||||||||||||||||||||||||||||||||||||||||||||||||||||||||||||
2004 - 2018 National Fire Incident Reporting System (NFIRS) incidents
- Incident types reported to NFIRS in East Pittsburgh, PA
- 22023.7%Hazardous Condition
- 20522.1%Fire
- 19420.9%False Alarm
- 18620.0%Good Intent Call
- 707.5%Rescue & EMS
- 465.0%Service Call
- 50.5%Special Incident
- 20.2%Overpressure Rupture
- 10.1%Severe Weather
- Fire incident types reported to NFIRS in East Pittsburgh, PA
- 14972.7%Structure Fires
- 2311.2%Other
- 209.8%Outside Fires
- 136.3%Mobile Property/Vehicle Fires
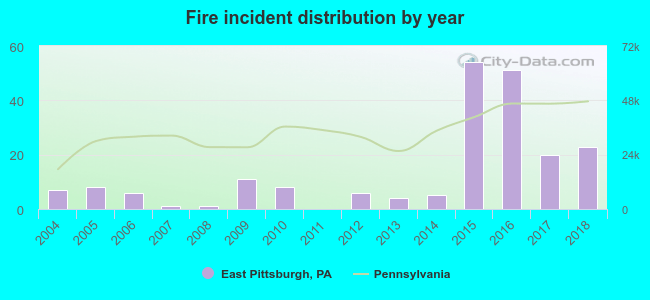 According to the data from the years 2004 - 2018 the average number of fire incidents per year is 14. The highest number of reported fires - 54 took place in 2015, and the least - 0 in 2011. The data has an increasing trend.
 25.4% incidents where reported in the morning and 74.6% in the evening. The most fires (19.5%) took place on Thursday, and the least (8.8%) on Tuesday.
 Based on the 205 incident reports from years 2004 - 2018 most fires (11.2%) took place during July, and the least (2.4%) in April.
 Out of all 929 cases reported during the years 2004 - 2018, the most belonged to the categories: Hazardous Condition (23.7%), Fire (22.1%), and False Alarm (20.9%).
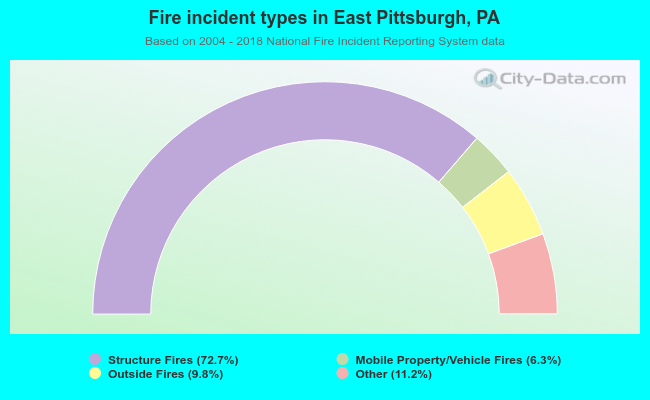 When looking into fire subcategories, the most reports belonged to: Structure Fires (72.7%), and Other (11.2%).